
Category: Parkinson's disease: Neuroimaging
Objective: To evaluate multimodal MRI discrimination of Parkinson’s disease using RPCA–kNN and associations with MDS-UPDRS.
Background: Parkinson’s disease (PD) involves progressive neurodegeneration affecting basal ganglia motor networks [1,2]. Advanced magnetic resonance imaging (MRI) metrics, including volumetry, diffusion MRI (dMRI), quantitative susceptibility mapping (QSM), and relaxation rate (R2*), capture complementary microstructural and magnetic alterations that may improve disease characterization beyond clinical motor scales [3].
Method: PD patients (n=10) were classified as Tremor Dominant (TD) or Postural Instability/Gait Difficulty (PIGD) [4]. Healthy controls (n=8) were matched by age, sex, and education [Table 1].
Imaging was performed on a 3T scanner, including T1, QSM, and dMRI. QSM and R2* maps were reconstructed from multi-echo GRE data following clinical QSM recommendations [5]. Phase unwrapping used ROMEO [6], background field removal used PDF [7], and dipole inversion used FANSI [8]. dMRI data were corrected with TOPUP [9] and EDDY [10]. FA and MD maps were derived using DTIFIT (FSL). Deep grey-matter and brainstem structures were segmented with FSL_FIRST [11], major motor white-matter tracts obtained from the JHU atlas (FSL), and volumetric measures were estimated with FreeSurfer [Figure 1].
Bilateral measures were averaged. Multimodal MRI metrics were integrated using Robust PCA and classified with k-nearest neighbors (kNN). Correlations between RPCA components and MDS-UPDRS were assessed using Pearson or Spearman tests with FDR correction.
Results: Multimodal MRI dimensionality reduction differentiated Parkinson’s disease from controls. Deep grey-matter/brainstem and white-matter models showed similar performance (sensitivity = 0.70, specificity = 0.75, PPV = 0.78, NPV = 0.67). Integrating all modalities improved sensitivity (0.80) and balanced predictive values (PPV = 0.73, NPV = 0.71), supporting the benefit of multimodal integration [Figure 2]. No significant correlations were observed between RPCA components and MDS-UPDRS-III scores [Table 2]. Phenotype-based RPCA (TD, PIGD, indeterminate, controls) showed overlapping distributions without clear clustering [Figure 3].
Conclusion: Multimodal MRI integration using RPCA–kNN distinguished Parkinson’s disease from controls and improved sensitivity with white-matter features, supporting biomarker-based stratification beyond clinical scores.
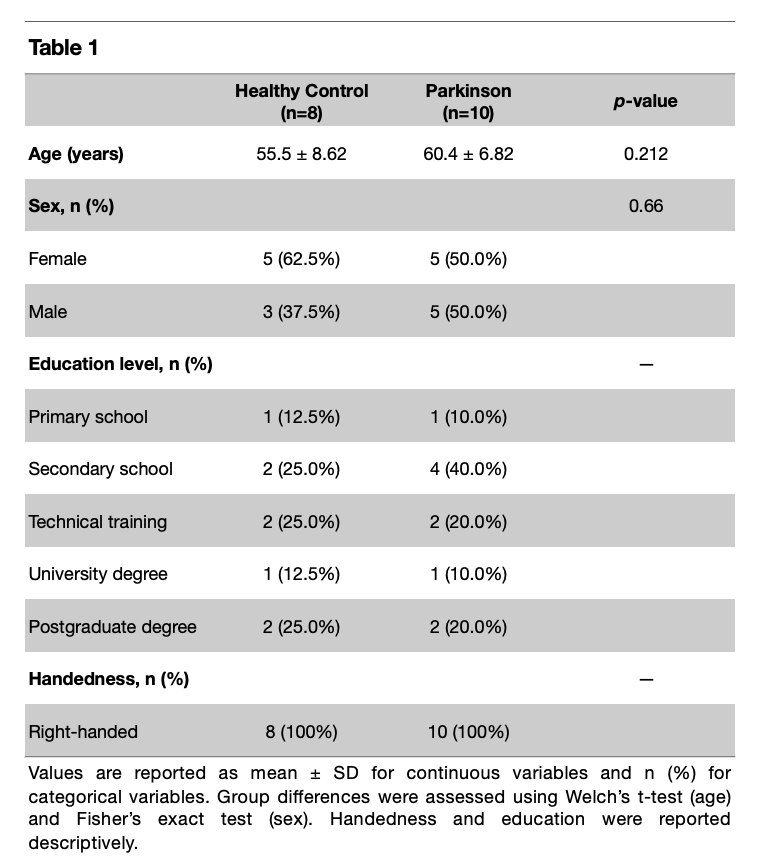
Participants characteristics
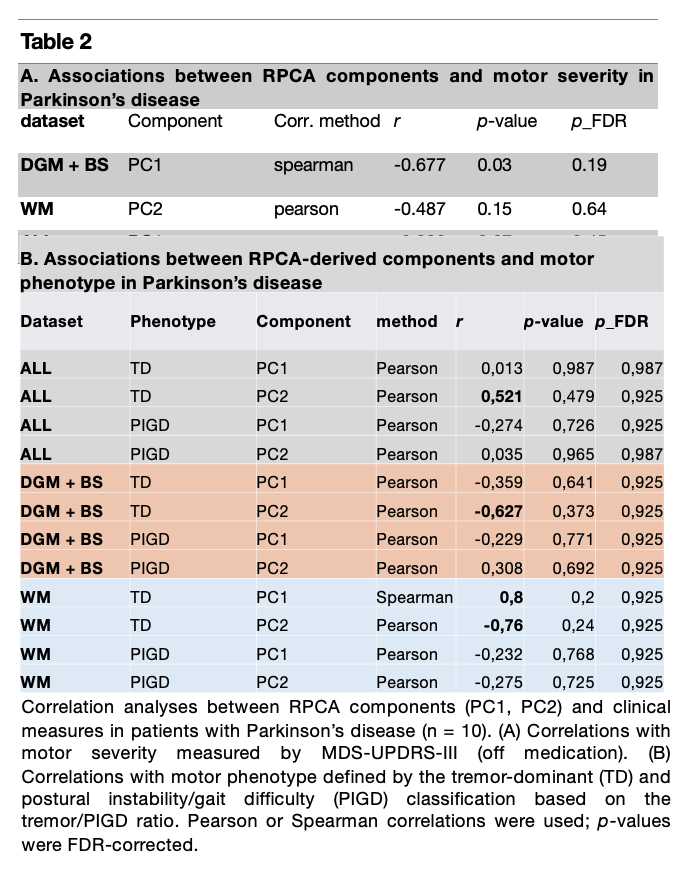
RPCA components and motor measures in PD
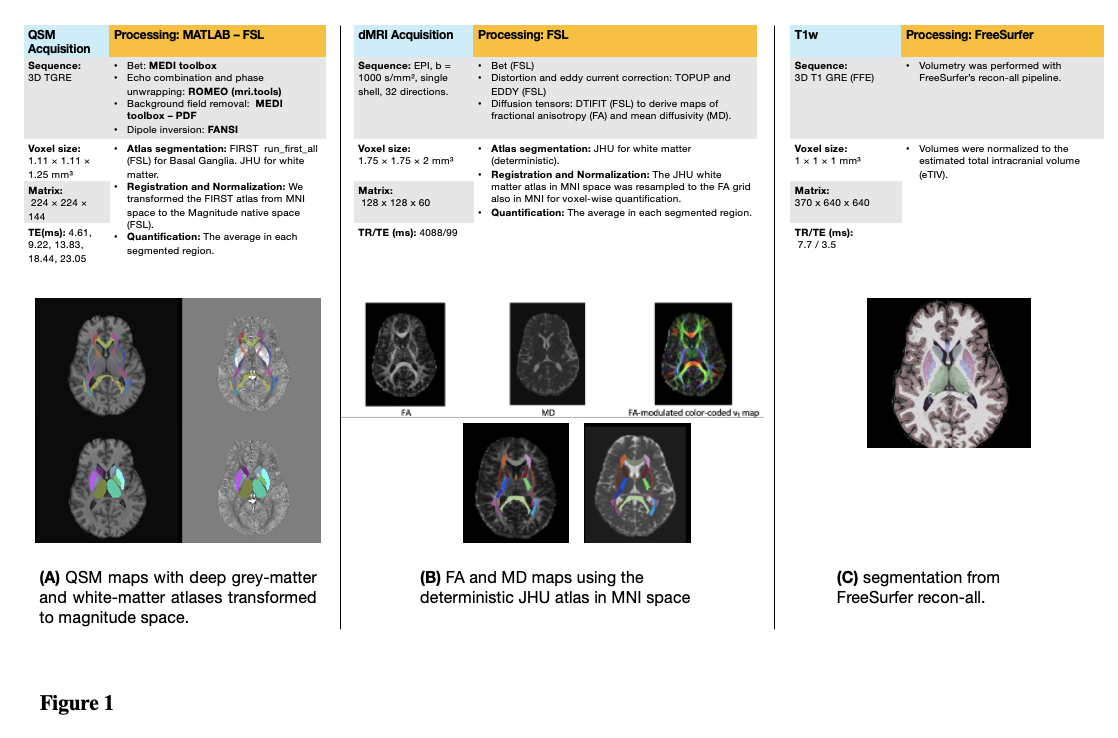
Multimodal MRI acquisition and processing workflow
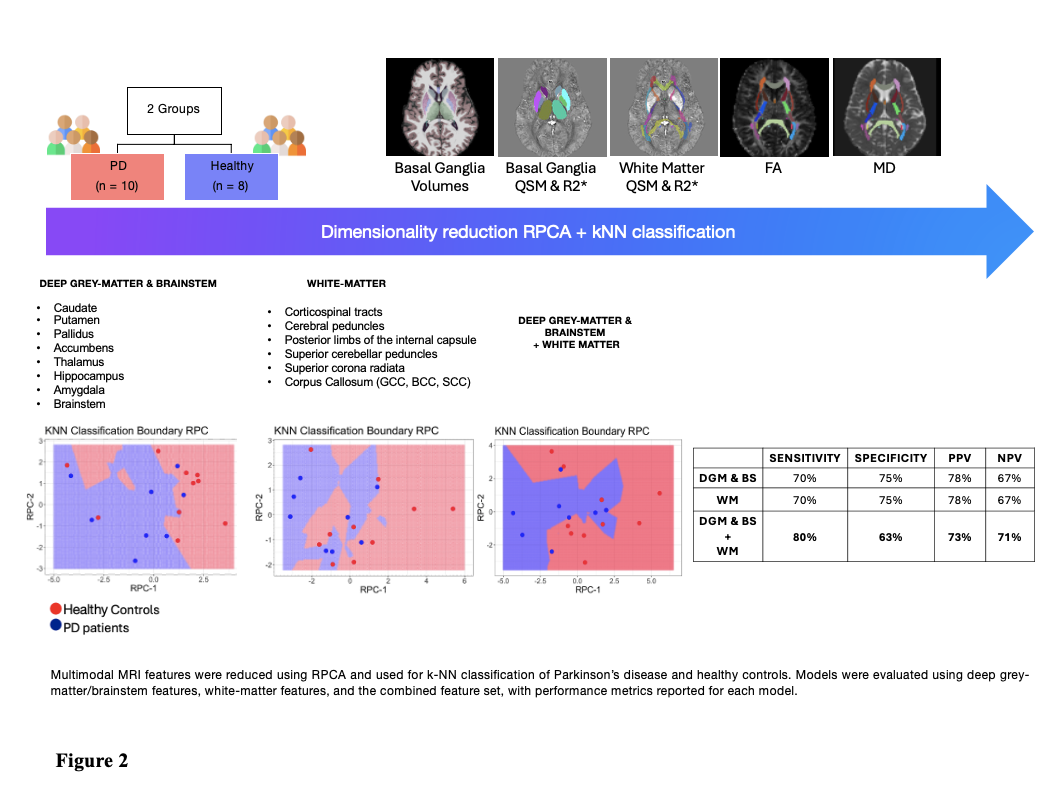
RPCA-based multimodal MRI classification in PD
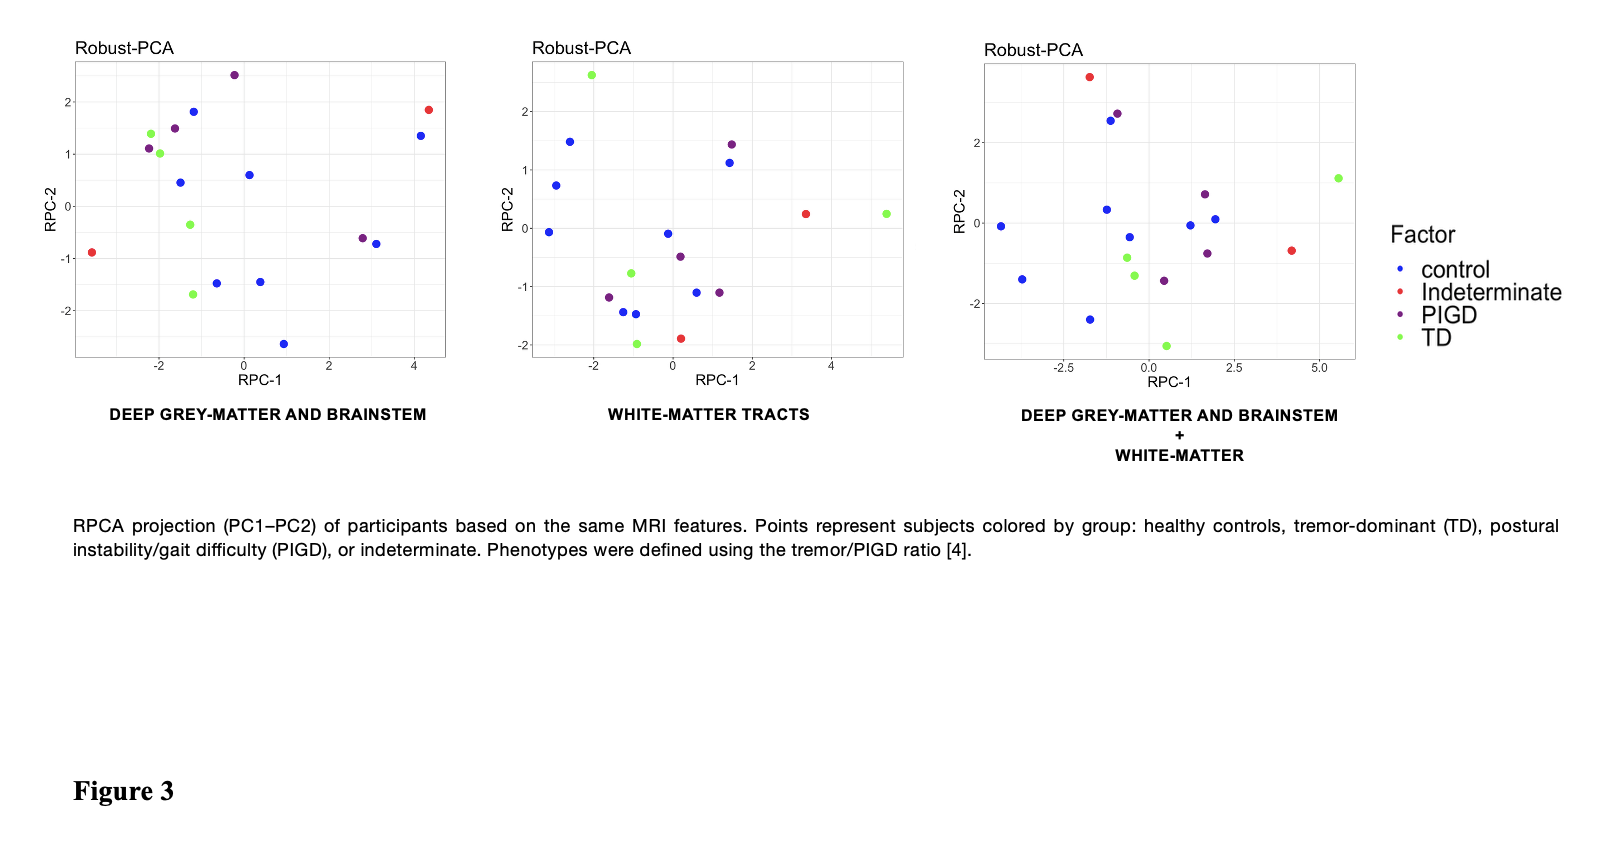
RPCA components stratified by motor phenotype
References: 1. W. Poewe et al., ‘Parkinson disease’, Nat Rev Dis Primers, vol. 3, 2017, doi: 10.1038/nrdp.2017.13.
2. W. Poewe, ‘Parkinson disease Primer – a true team effort’, Nat Rev Dis Primers, vol. 6, no. 1, p. 31, 2020, doi: 10.1038/s41572-020-0163-3.
3. F. Nikparast, Z. Ganji, and H. Zare, ‘Early differentiation of neurodegenerative diseases using the novel QSM technique: what is the biomarker of each disorder?’,
BMC Neurosci, vol. 23, no. 1, Dec. 2022, doi: 10.1186/s12868-022-00725-9.
4. G. T. Stebbins, C. G. Goetz, D. J. Burn, J. Jankovic, T. K. Khoo, and B. C. Tilley, ‘How to identify tremor dominant and postural instability/gait difficulty groups
with the movement disorder society unified Parkinson’s disease rating scale: Comparison with the unified Parkinson’s disease rating scale’, Movement disorders,
vol. 28, no. 5, pp. 668–670, 2013, doi: 10.1002/mds.25383.
5. B. Bilgic et al., ‘Recommended implementation of quantitative susceptibility mapping for clinical research in the brain: A consensus of the ISMRM electro-
magnetic tissue properties study group’, Magn Reson Med, vol. 91, no. 5, pp. 1834–1862, 2024, doi: 10.1002/mrm.30006.
6. B. Dymerska et al., ‘Phase unwrapping with a rapid opensource minimum spanning tree algorithm (ROMEO)’, Magn Reson Med, vol. 85, no. 4, 2021, doi:
10.1002/mrm.28563.
7. T. Liu et al., ‘A novel background field removal method for MRI using projection onto dipole fields (PDF)’, NMR Biomed, vol. 24, no. 9, 2011, doi:
10.1002/nbm.1670.
8. C. Milovic, B. Bilgic, B. Zhao, J. Acosta-Cabronero, and C. Tejos, ‘Fast nonlinear susceptibility inversion with variational regularization’, Magn Reson Med, vol.
80, no. 2, 2018, doi: 10.1002/mrm.27073.
9. J. L. R. Andersson, S. Skare, and J. Ashburner, ‘How to correct susceptibility distortions in spin-echo echo-planar images: Application to diffusion tensor
imaging’, Neuroimage, vol. 20, no. 2, 2003, doi: 10.1016/S1053-8119(03)00336-7.
10. J. L. R. Andersson and S. N. Sotiropoulos, ‘An integrated approach to correction for off-resonance effects and subject movement in diffusion MR imaging’,
Neuroimage, vol. 125, 2016, doi: 10.1016/j.neuroimage.2015.10.019.
11. B. Patenaude, S. M. Smith, D. N. Kennedy, and M. Jenkinson, ‘A Bayesian model of shape and appearance for subcortical brain segmentation’, Neuroimage, vol.
56, no. 3, 2011, doi: 10.1016/j.neuroimage.2011.02.046.
To cite this abstract in AMA style:
P. González-Méndez, N. Castillo-Triana, C. Juri, M. Andia. Multimodal Quantitative MRI Improves Parkinson’s Disease Classification [abstract]. Mov Disord. 2026; 41 (suppl 1). https://www.mdsabstracts.org/abstract/multimodal-quantitative-mri-improves-parkinsons-disease-classification/. Accessed October 1, 2026.« Back to 2026 International Congress
MDS Abstracts - https://www.mdsabstracts.org/abstract/multimodal-quantitative-mri-improves-parkinsons-disease-classification/