
Category: Parkinson's disease: Neuroimaging
Objective: To characterise the coupling between regional mitochondrial density and complex I activity and spatially patterned brain atrophy in Parkinson’s disease (PD), and its variation across genetic subgroups.
Background: Mitochondrial dysfunction has been consistently implicated in the pathobiology of selective neuronal vulnerability in PD, (1) and emerging data-driven subtyping evidence suggests this vulnerability is regionally heterogeneous. (2,3,4) Yet the synergistic relationship between regional energetic demand and spatial patterns of neurodegeneration remains unclear limiting mechanistic insight and hindering the development of biologically grounded biomarkers and disease-modifying therapies.
Method: Regional brain volumes were extracted using FreeSurfer from structural MRI data of 864 participants (213 healthy controls and 651 patients with PD including PD-GBA, PD-LRRK2, and PD-PRKN variants). Mitochondrial variables were derived from recently published brain-wide mitochondrial maps. (5) Partial least squares (PLS) analyses characterised covariation between MRI-derived brain atrophy patterns and mitochondrial markers. In an independent analysis, principal component analysis (PCA) was performed to test and validate additional trajectories of neurodegeneration.
Results: Patients with PD showed reduced volumes in limbic and subcortical regions relative to controls. GBA and LRRK2 carriers exhibited additional frontal, putaminal, and occipital atrophy compared to sporadic PD, with relative preservation of subcortical structures. PLS (Figure 1) and PCA converged on a limbic–striatal/posterior cortical atrophy axis significantly coupled to mitochondrial markers (ρ = 0.485, p<0.001). This axis correlated with visuospatial deficits (MoCA visuospatial) and MDS-UPDRS III (both p<0.05). This axis was more strongly expressed in PD-GBA and PD-LRRK2 groups than in sporadic PD (p<0.001), reflecting heightened mitochondrial-atrophy coupling in these genetic groups.
Conclusion: These findings provide a biological basis linking the brain’s regional mitochondrial landscape to heterogeneous neurodegeneration in PD, with amplification in certain PD genetic groups. This mitochondrial atrophy axis may provide a biologically grounded readout for patient stratification, tracking disease progression, and enrichment of trials targeting mitochondrial dysfunction.
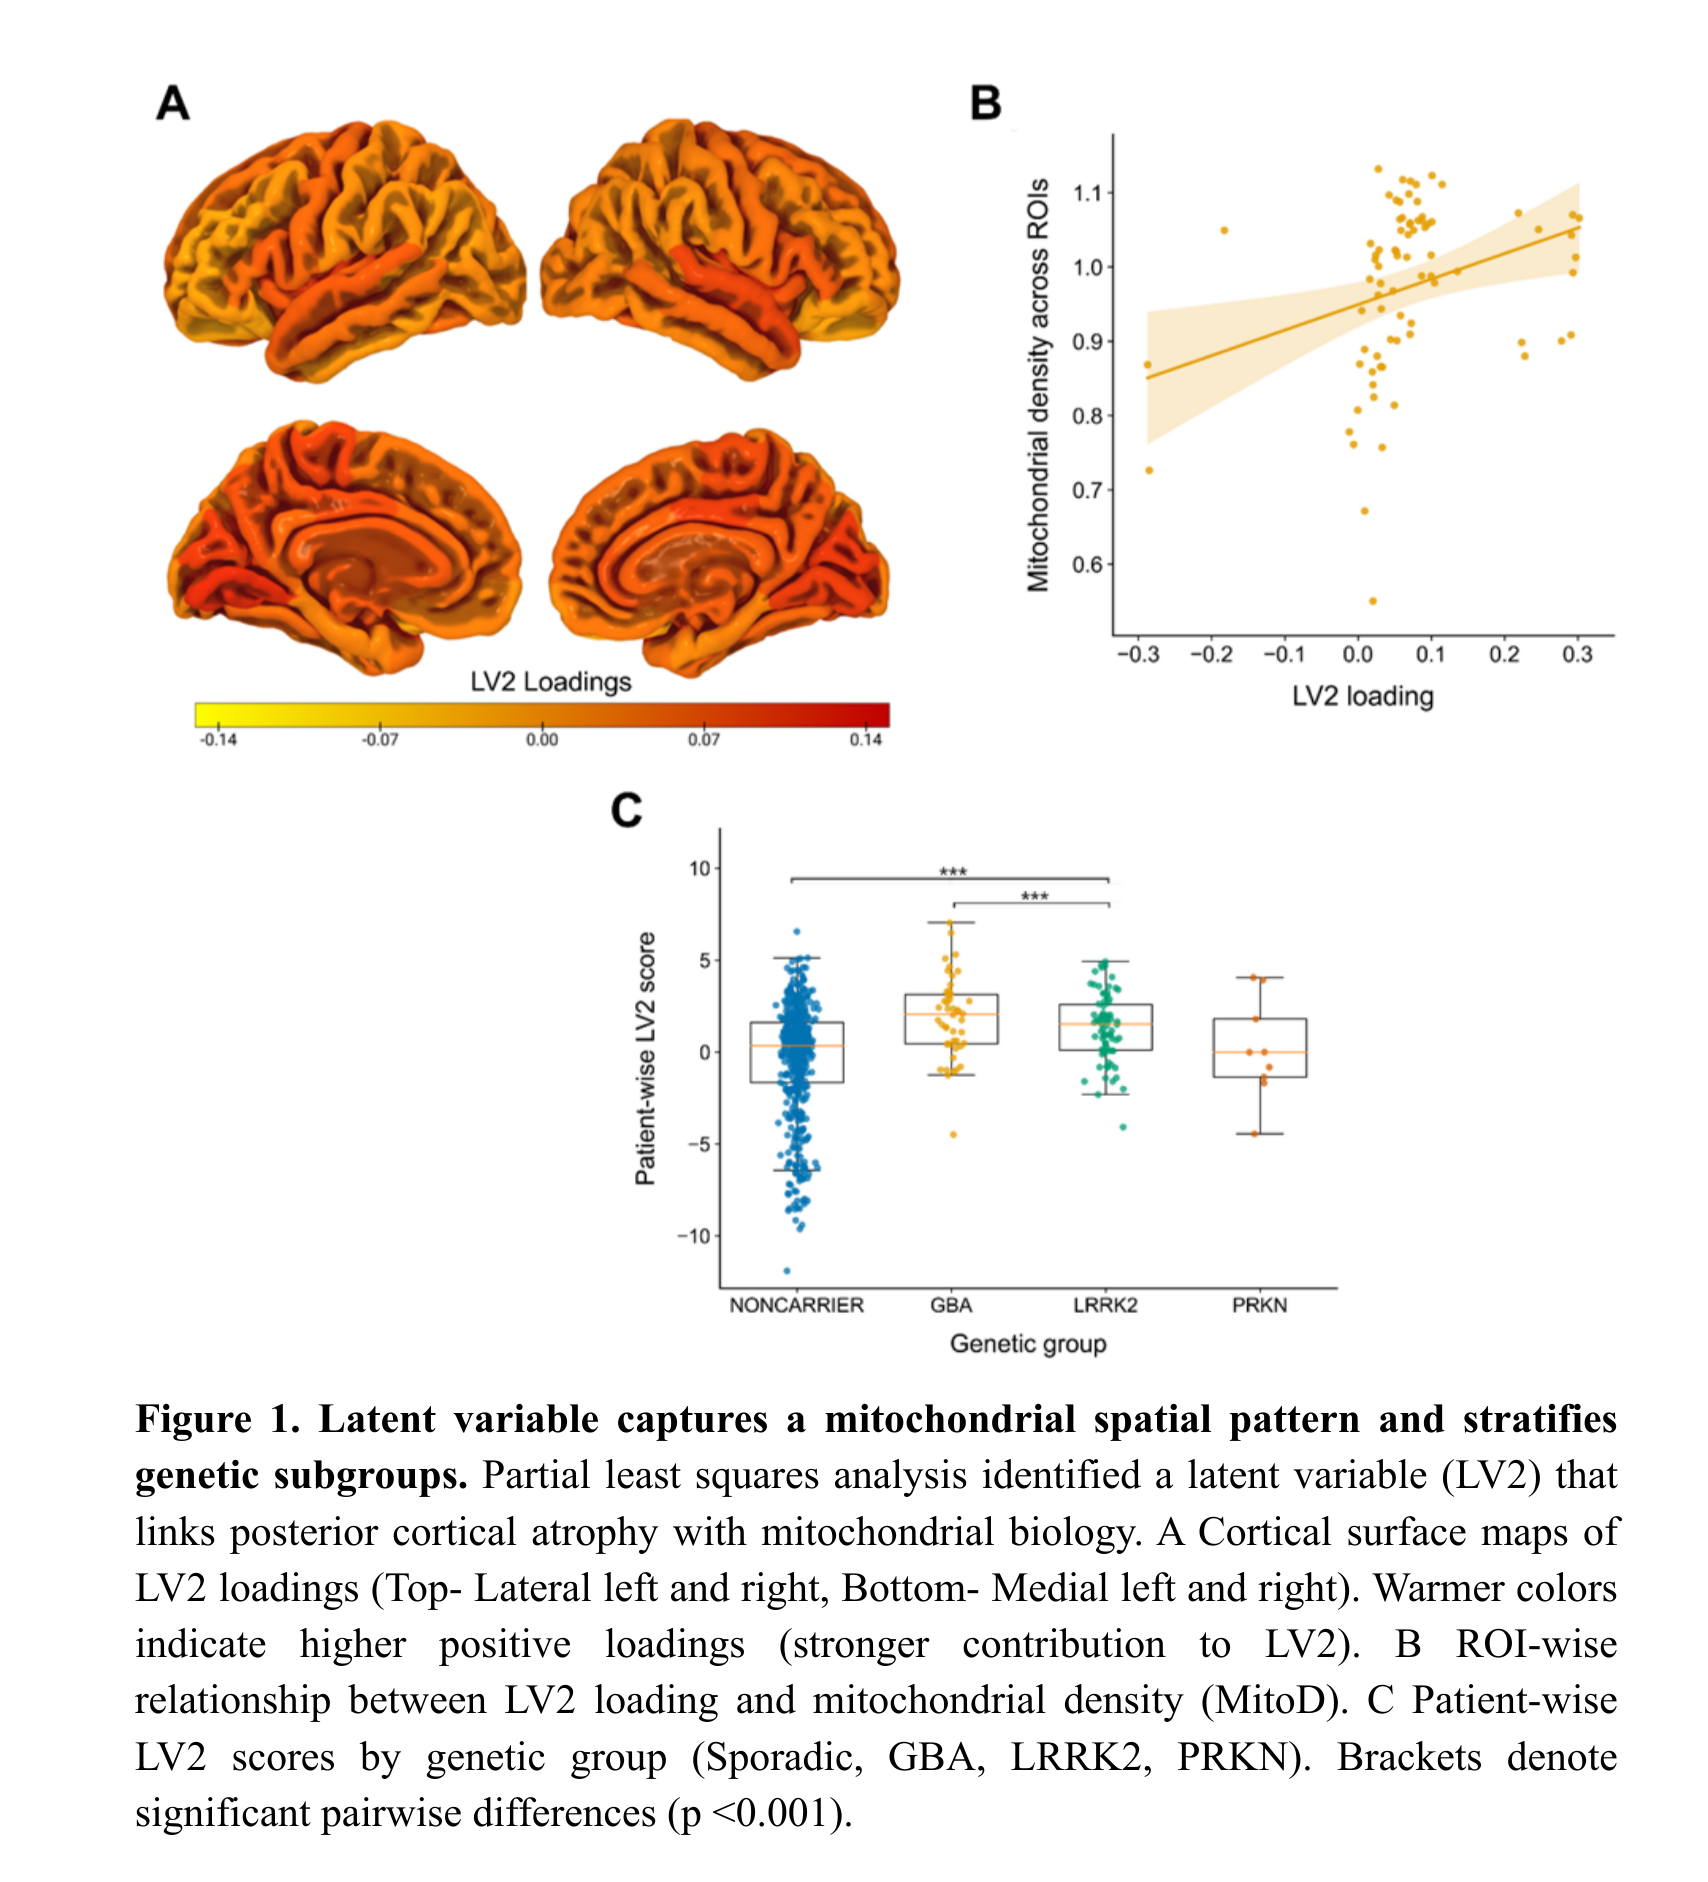
Figure 1
References: 1. Henrich, M. T., Oertel, W. H., Surmeier, D. J. & Geibl, F. F. Mitochondrial dysfunction in Parkinson’s disease – a key disease hallmark with therapeutic potential. Mol. Neurodegener. 18, 83 (2023).
2. Sakato, Y. et al. Delineating three distinct spatiotemporal patterns of brain atrophy in Parkinson’s disease. Brain 147, 3702–3713 (2024).
3. Shawa, Z. et al. Neuroimaging-based data-driven subtypes of spatiotemporal atrophy due to Parkinson’s disease. Brain Commun. 7, (2025).
4. Konuri, A. et al. Data-driven trajectories of atrophy explain clinical heterogeneity across Lewy body diseases. medRxiv 10, 2026.01.29.26344990 (2026).
5. Mosharov, E. V. et al. A human brain map of mitochondrial respiratory capacity and diversity. Nature 641, 749–758 (2025).
To cite this abstract in AMA style:
A. Konuri, L. Churchill, J. Anderson, A. Ignatavicius, G. Halliday, R. Landin-Romero, S. Lewis, E. Matar. Mitochondrial Density Shapes Regional Vulnerability to Atrophy in Parkinson’s Disease [abstract]. Mov Disord. 2026; 41 (suppl 1). https://www.mdsabstracts.org/abstract/mitochondrial-density-shapes-regional-vulnerability-to-atrophy-in-parkinsons-disease/. Accessed October 1, 2026.« Back to 2026 International Congress
MDS Abstracts - https://www.mdsabstracts.org/abstract/mitochondrial-density-shapes-regional-vulnerability-to-atrophy-in-parkinsons-disease/