
Category: Parkinson's disease: Neuroimaging
Objective: Define the microstructural correlates of bradykinesia in Parkinson’s disease.
Background: Bradykinesia is defined as “slowness of movement”, often associated with decrement, and linked to dopamine cell loss [1]. Motor errors are often included with bradykinesia, yet may be due to different mechanisms.
Quantitative MRI (qMRI) provides voxel-wise measures of brain tissue properties including [2]:
-Magnetization Transfer (MT): Myelin density.
-Proton Density (PD): MRI-visible water.
-R1: Combination of iron, PD and myelin density.
-R2*: Iron density.
-Quantitative susceptibility map (QSM): Combination of iron, calcium and myelin density.
Method: Data from 106 participants with early Parkinson’s (<2y post-diagnosis) from the Quantitative MRI for Anatomical Phenotyping in Parkinson’s Disease study was used. The Modified Bradykinesia Rating Scale (MBRS) was used to score speed, amplitude and rhythm errors for each limb. These were summed for the left and right providing 6 total scores for analysis.
Participants underwent 1h 3T MRI including the multi-parameter mapping (MPM) protocol. These were pre-processed using the hMRI toolbox [3]. A two-pass quantitative segmentation pipeline was used to map 8 tissue classes (4 cortical, 4 brainstem). The SHOOT toolbox was used to generate group average space. Warped-modulated and warp-weighted averages were created for every parameter and tissue class using 6mm smoothing for the cortex and 2mm in the brainstem. Prior to analysis an a priori anatomical motor network was created.
A multiple regression analysis performed in SPM12: All total MBRS scores were included plus sex, age and intracranial volume. Speed and amplitude were highly correlated (>0.9) hence combined. Positive and negative correlates for bilateral speed-amplitude and rhythm scores were contrasted. Each tissue-class was analysed separately and results combined. Uncorrected P<0.001 was significant within the a priori network.
Results: More severe damage and atrophy was found within cognitive-planning regions including parietal and temporal cortices and linked white-matter regions. Milder damage was found in more classic motor regions (primary, pre-motor, cerebellum) [Figure 1].
Conclusion: Motor errors are separate to bradykinesia and linked to more severe damage in cognitive-planning regions. Whilst no brainstem findings were found, this may be due to early PD asymmetry. Mirroring MRI data to create lesion locked alignment may help boost this analysis.
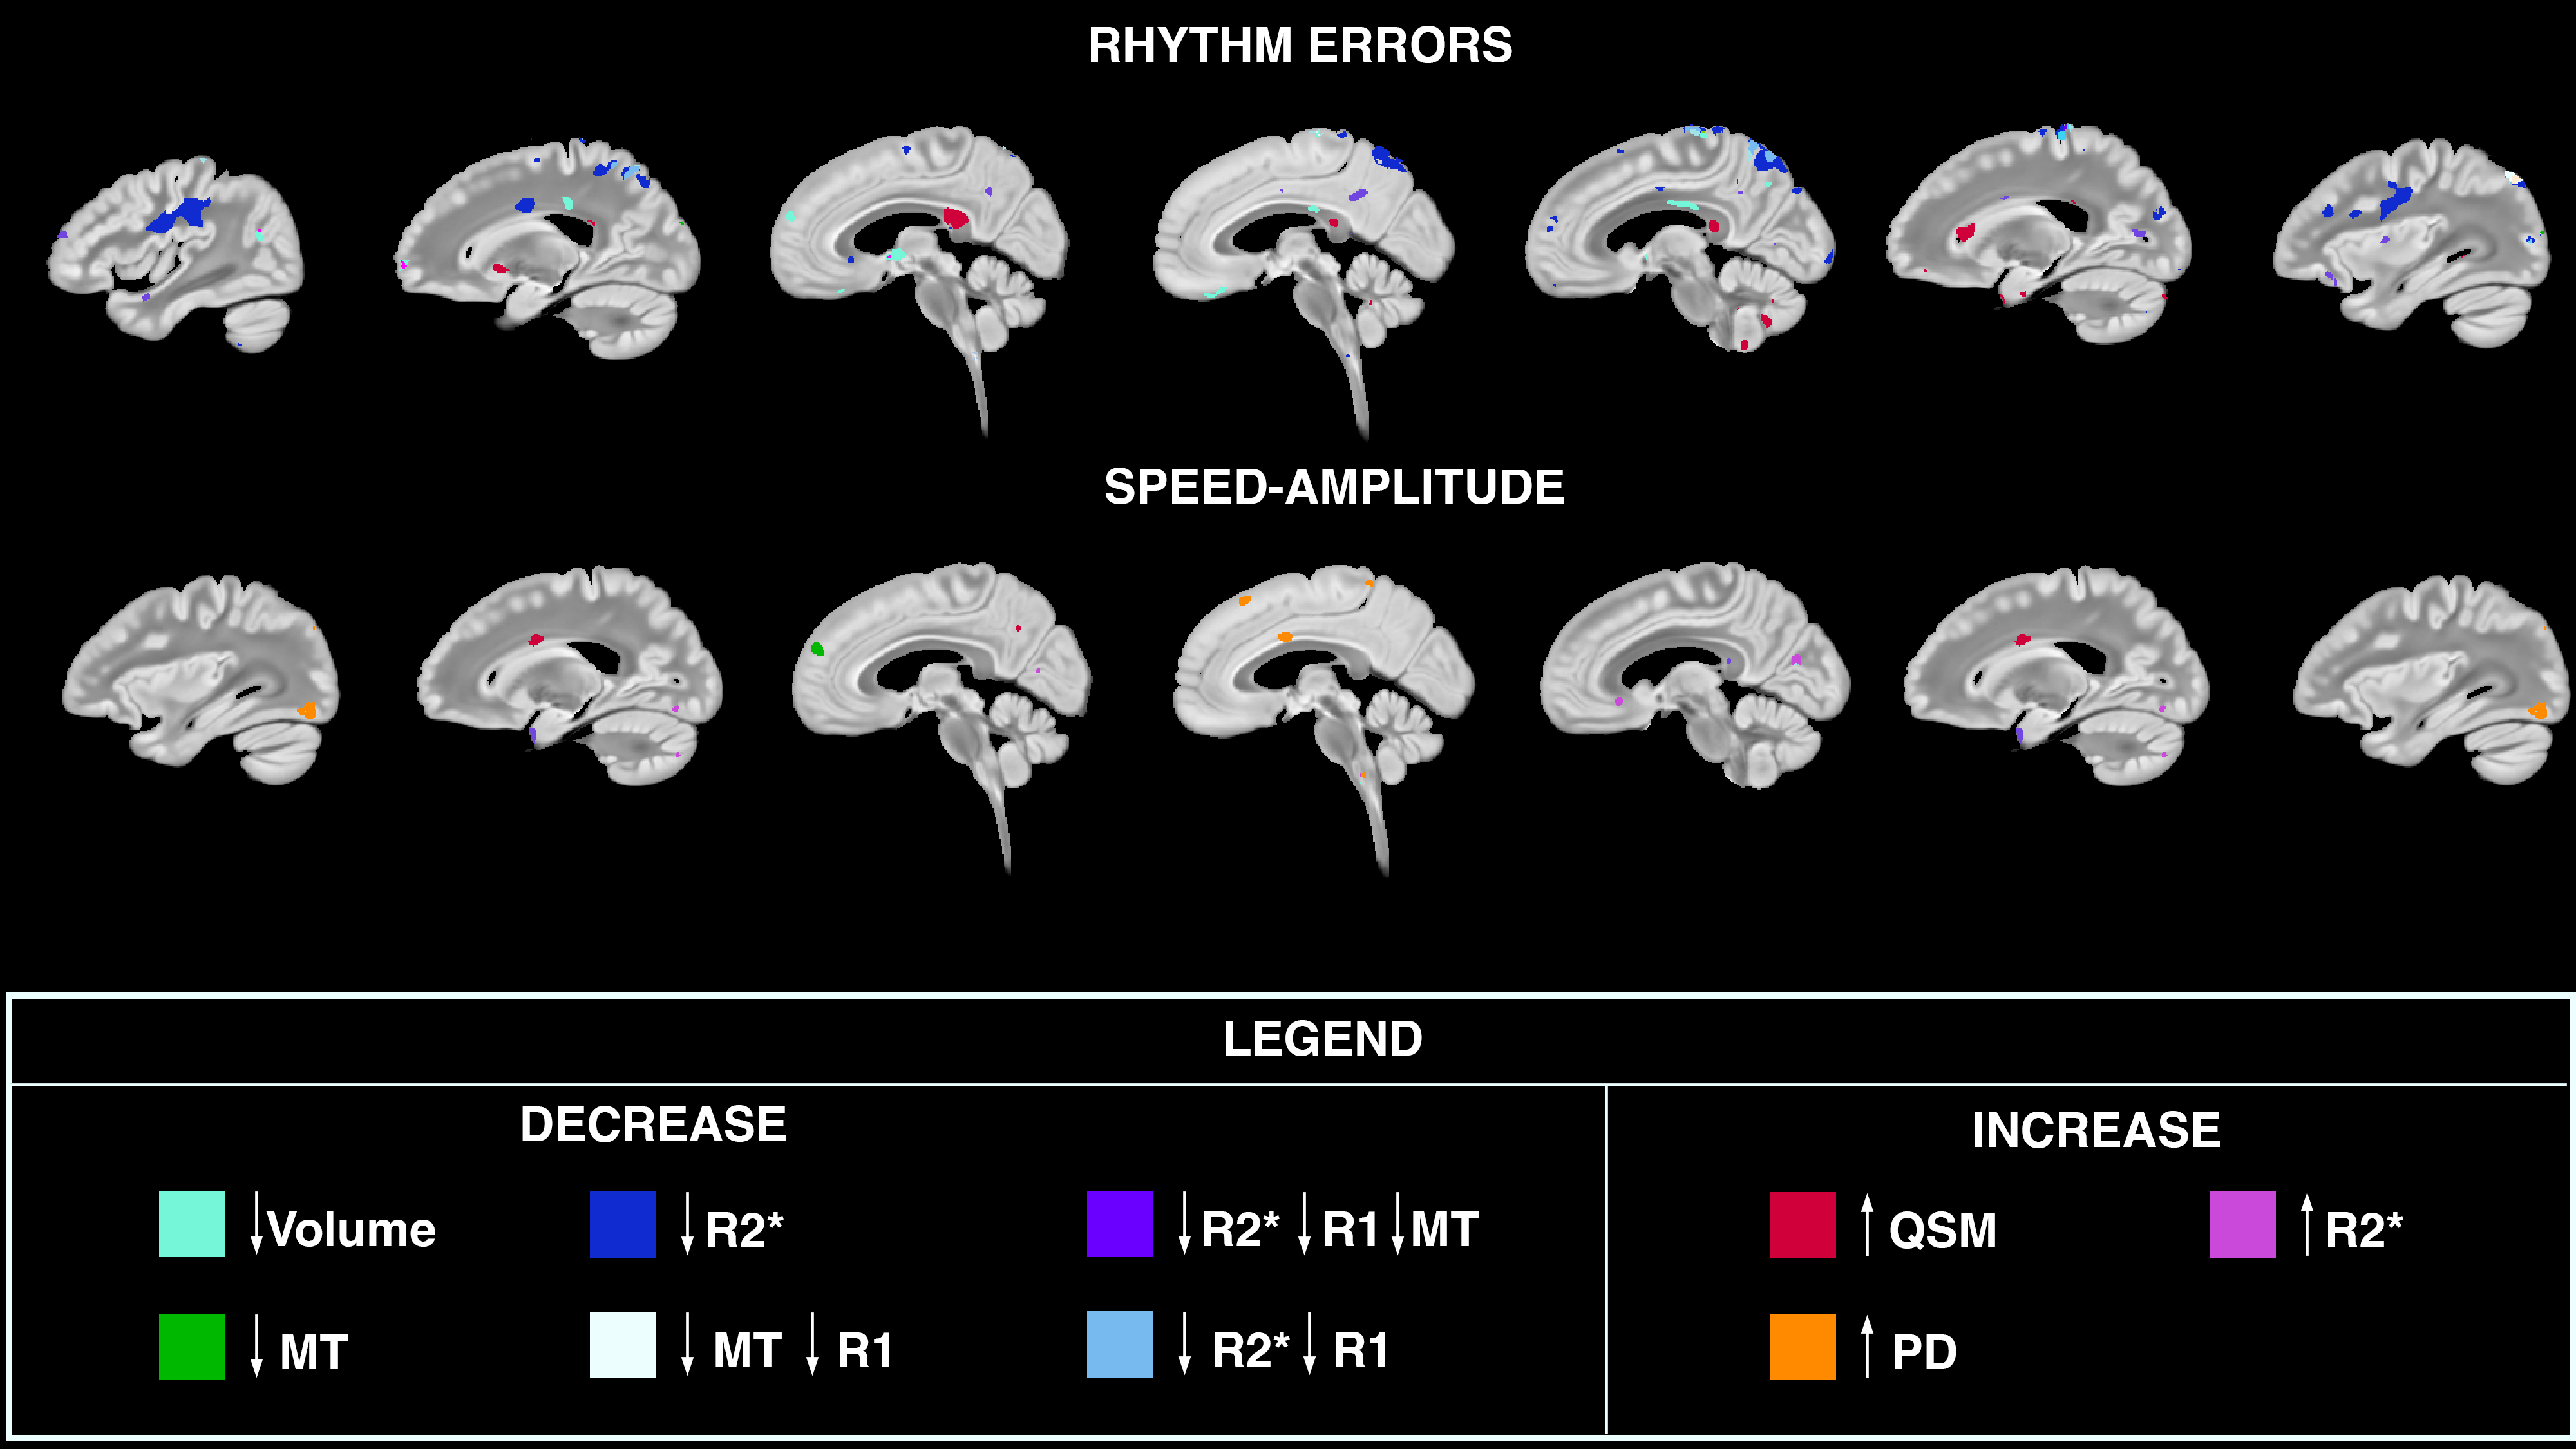
Rhythm errors and speed-amplitude analysis
References: [1]- Bologna M, Paparella G, Fasano A, Hallett M, Berardelli A. Evolving concepts on bradykinesia. Brain. 2019 Dec 13;143(3):727–50.
[2]- Lambert C, Chowdhury R, FitzGerald THB, Fleming SM, Lutti A, Hutton C, et al. Characterizing Aging in the Human Brainstem Using Quantitative Multimodal MRI Analysis. Frontiers in Human Neuroscience. 2013 Aug 20;7.
[3]- Tabelow K, Balteau E, Ashburner J, Callaghan MF, Bogdan Draganski, Helms G, et al. hMRI – A toolbox for quantitative MRI in neuroscience and clinical research. 2019 Jul 1;194:191–210.
To cite this abstract in AMA style:
R. Benabderrazik, S. Jasaityte, C. Dore, N. Smith, G. Sheehan, C. Lambert. Microstructural Correlates of Parkinson’s Bradykinesia [abstract]. Mov Disord. 2026; 41 (suppl 1). https://www.mdsabstracts.org/abstract/microstructural-correlates-of-parkinsons-bradykinesia/. Accessed October 1, 2026.« Back to 2026 International Congress
MDS Abstracts - https://www.mdsabstracts.org/abstract/microstructural-correlates-of-parkinsons-bradykinesia/