Category: Tremor
Objective: To investigate the correlation of the machine learning-based tremor extracted features with tremor Research Group Essential Tremor Rating Assessment Scale (TETRAS) and to identify key determinants of tremor’s severity.
Background: Standardized clinical scales have been developed to assess tremor’s severity and its functional impact. However, these scales are rater-dependent and time-consuming. Thus, identifying key features correlated with tremor’s severity enables efficient patient follow-up and a better understanding of its impact.
Method: We recruited patients with tremor (Essential tremor (ET), ET plus, parkinsonian and cerebellar tremor). All patients underwent TETRAS assessment including the drawing of the Archimede’s spiral for each hand and its duration. A computational image processing pipeline was designed to extract salient features from spiral drawings. We automatically detected the manual spiral tracing, designed a flattening algorithm that allows an easy reading of hand movement and calculates the gap between the ideal spiral and the traced one. Overall, we extract X features from the flattened spiral and compute Pearson’s correlation between each feature and severity scores.
Results: A total of 35 spirals were implemented in the AI algorithm. Among the extracted features, tremor amplitude correlated with TETRAS total score (p=0.005,r=0.467) and with Activity of Daily Living (ADL) (p<0.001,r=0.584). Standard deviation also correlated with TETRAS total score (p=0.03,r=0.481) and ADL (p<0.001,r=0.601). Directional change was correlated with ADL (p=0.018,r=0.399) and upper limb tremor (p=0.036,r=0.355). Similarly, total arc length correlated with ADL (p=0.014,r=0.410) and upper limb tremor (p=0.034,r=0.395). Yet, no correlations with dominant frequency or velocity were found.
Conclusion: Our results highlight that tremor severity is mainly due to tremor’s amplitude. Standard deviation was also strongly correlated with tremor’s severity which is plausible since it is itself directly linked to amplitude (amplitude = maximum – minimum deviation).Such finding lines with ET syndromes disease’s course where with tremor’s worsening, frequency decreases and amplitude increases resulting in functional disability worsening. It also supports the amplitude selection as choice criterion in TETRAS scale.
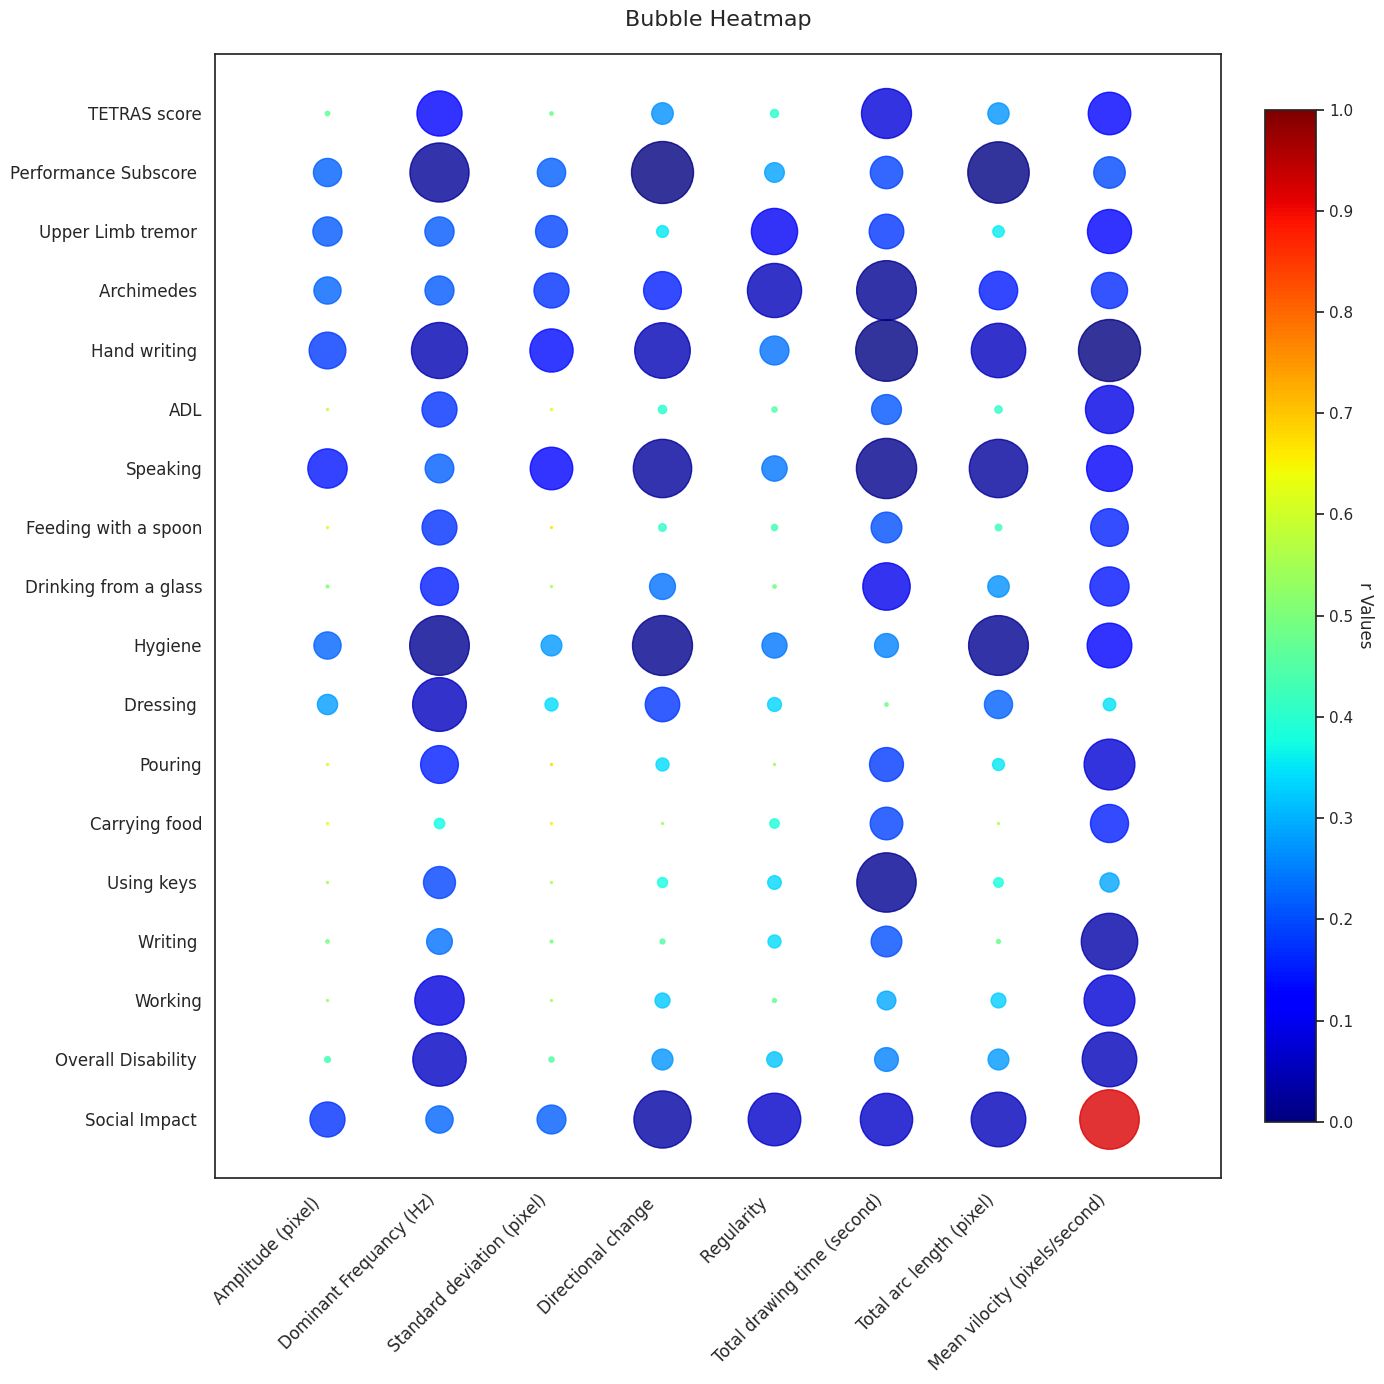
Correlation (p value and r value)
To cite this abstract in AMA style:
R. Guizani, A. Rekik, M. Abid, S. Laataoui, I. Rekik, S. Ben Amor. Investigating the most robust predictors of tremor’s severity using a computational image processing pipeline for automated feature extraction [abstract]. Mov Disord. 2025; 40 (suppl 1). https://www.mdsabstracts.org/abstract/investigating-the-most-robust-predictors-of-tremors-severity-using-a-computational-image-processing-pipeline-for-automated-feature-extraction/. Accessed July 6, 2026.« Back to 2025 International Congress
MDS Abstracts - https://www.mdsabstracts.org/abstract/investigating-the-most-robust-predictors-of-tremors-severity-using-a-computational-image-processing-pipeline-for-automated-feature-extraction/