Objective: To evaluate the validity of ExpressionTracker, an app generating personalized facial blendshapes, for objective quantification of hypomimia in patients with Parkinson’s disease (PD) [1].
Background: Hypomimia is characteristic of PD and may precede formal diagnosis by many years [2]. However, the widely used Unified Parkinson’s Disease Rating Scale (UPDRS Part III) does not allow for reliable assessment of hypomimia due to substantial interobserver variability and floor/ceiling effects [3].
Method: We utilized the ExpressionTracker app to capture 52 facial “blendshapes”, assigning each a coefficient (0–1) indicating the amount of deviation from each subject’s neutral facial expression (Figure 1). The Facial Blendshape Index (FBI) was subsequently defined as the average of these facial blendshapes, subdivided into different regions: FBI_upper (eyes/eyebrows), FBI_middle (nose/cheeks), FBI_lower (mouth/jaw), FBI_right and FBI_left (right and left side) (Figure 2). Redundant blendshapes were excluded based on limited contribution to facial expressivity (eyeBlinkLeft, eyeLookDownLeft, eyeLookInLeft, eyeLookOutLeft, eyeLookUpLeft), low variation (tongueOut, jawForward) or measurement difficulty (mouthFrown , mouthDimple and eyeSquint). We used ANOVA to adjust for potential confounders, including age, sex, and visit time.
Results: Forty-four participants (22 PD, 22 healthy controls (HC)) were enrolled (Table 1) FBI_total, FBI_middle and FBI_lower differed significantly between PD and HC subjects, although only the difference in FBI_lower survived correction for multiple comparison. (p=0.006, Cohen’s d=–0.878). Mann–Whitney U tests found significance in FBI_total (p=0.028) and FBI_middle (p=0.047); after multiple comparisons correction, only FBI_lower remained significant (p=0.023) (Figure 3 & Table 2). Correlation analysis showed significant inverse correlations between UPDRS III scores and FBI measures (FBI_total r=–0.394, FBI_middle r=–0.350, FBI_lower r=–0.371; p=0.031 each) (Table 2). After adjusting for age, gender, and visit time, the ANCOVA analysis of FMI_lower indicated that PD was significantly associated with lower FMI_lower values (β = -0.21, SE = 0.08, F(1,39) = 6.28, p = 0.016). (Table 3)
Conclusion: These preliminary findings suggest that objective quantification of facial expression through the FBI is promising as a diagnostic biomarker for PD. Further validation in larger longitudinal studies is warranted.
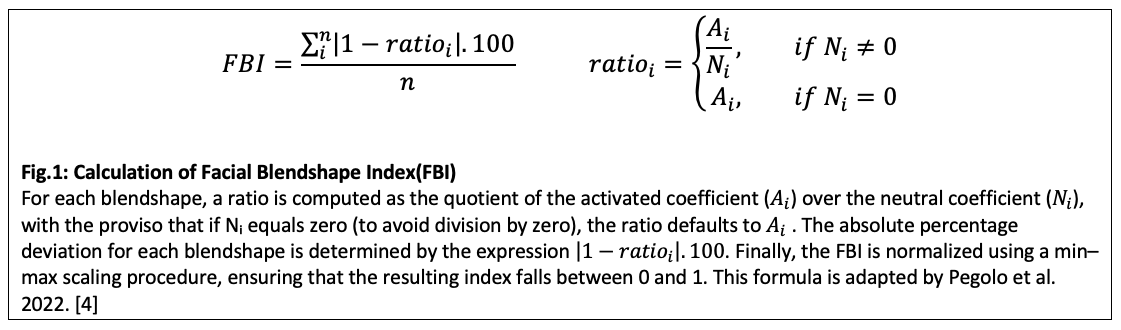
Fig.1: Calculation of Facial Blendshape Index(FBI)
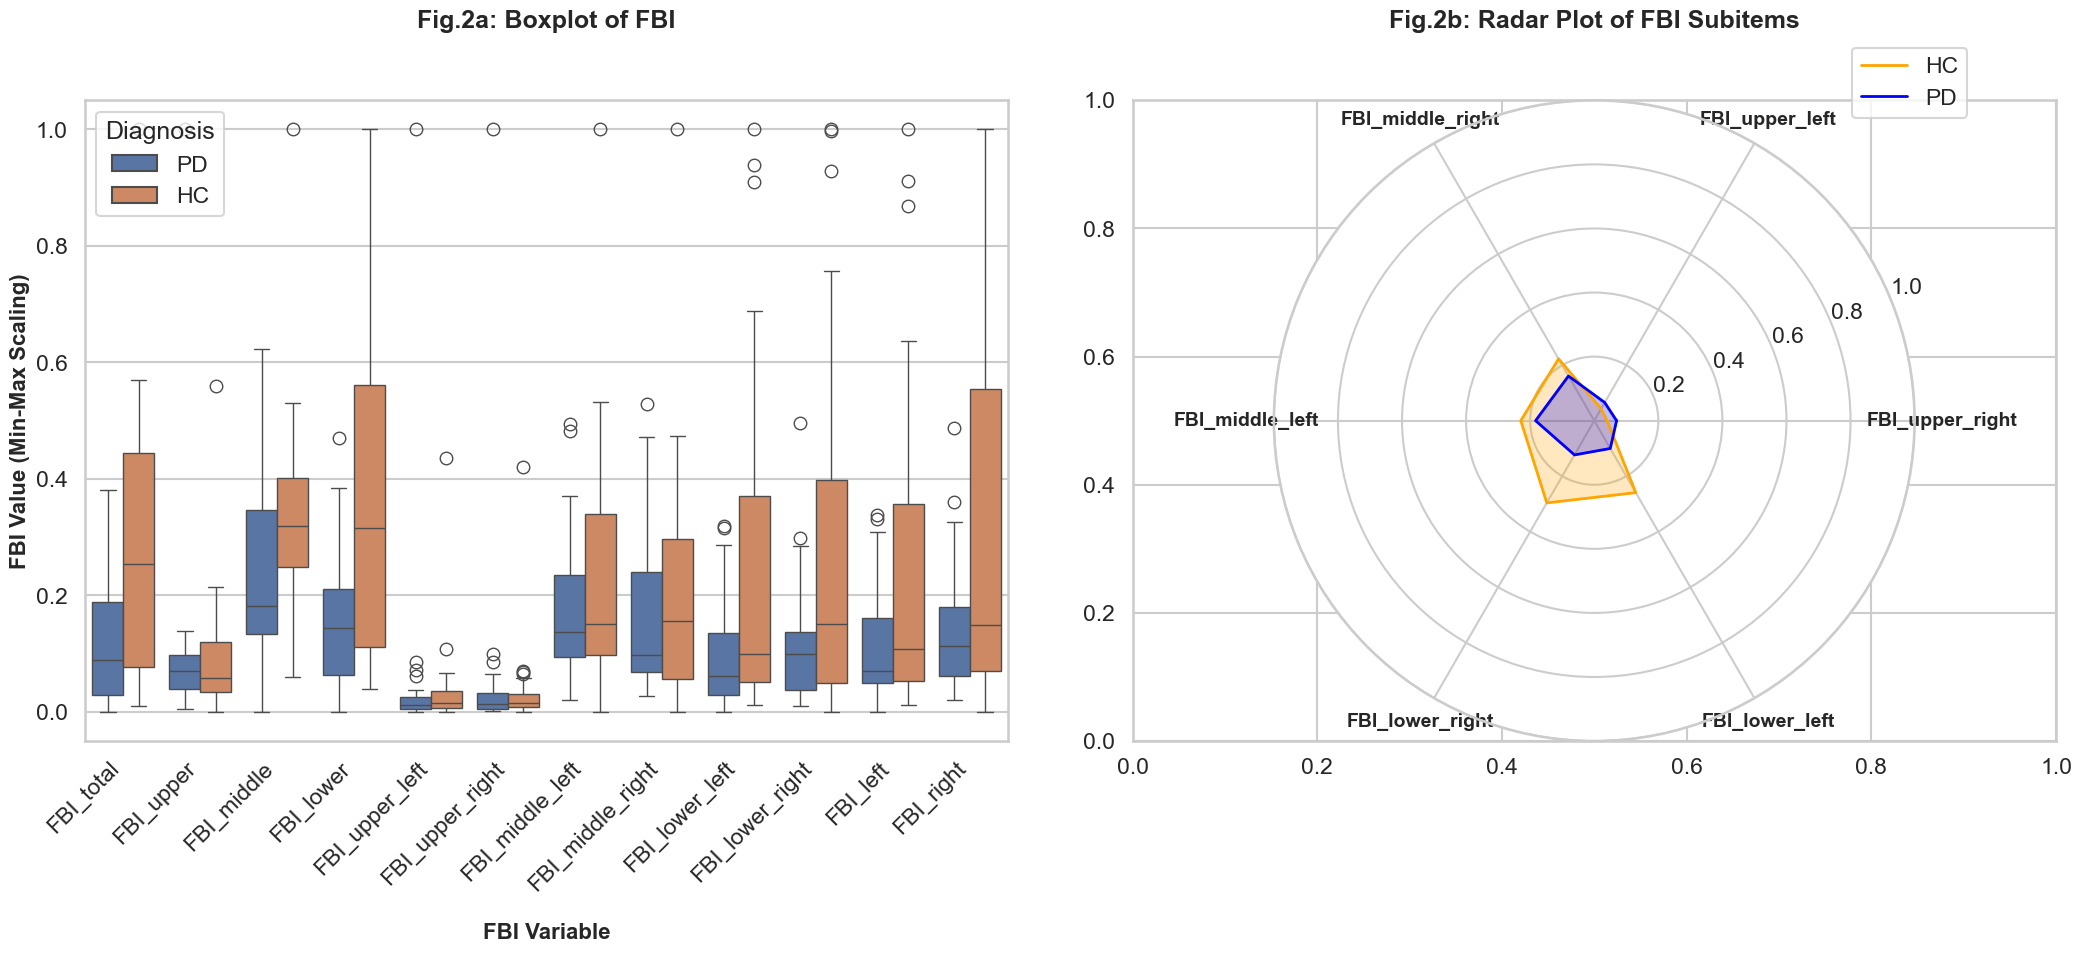
Fig.2: Boxplot and Radar Plot of FBI Subitems
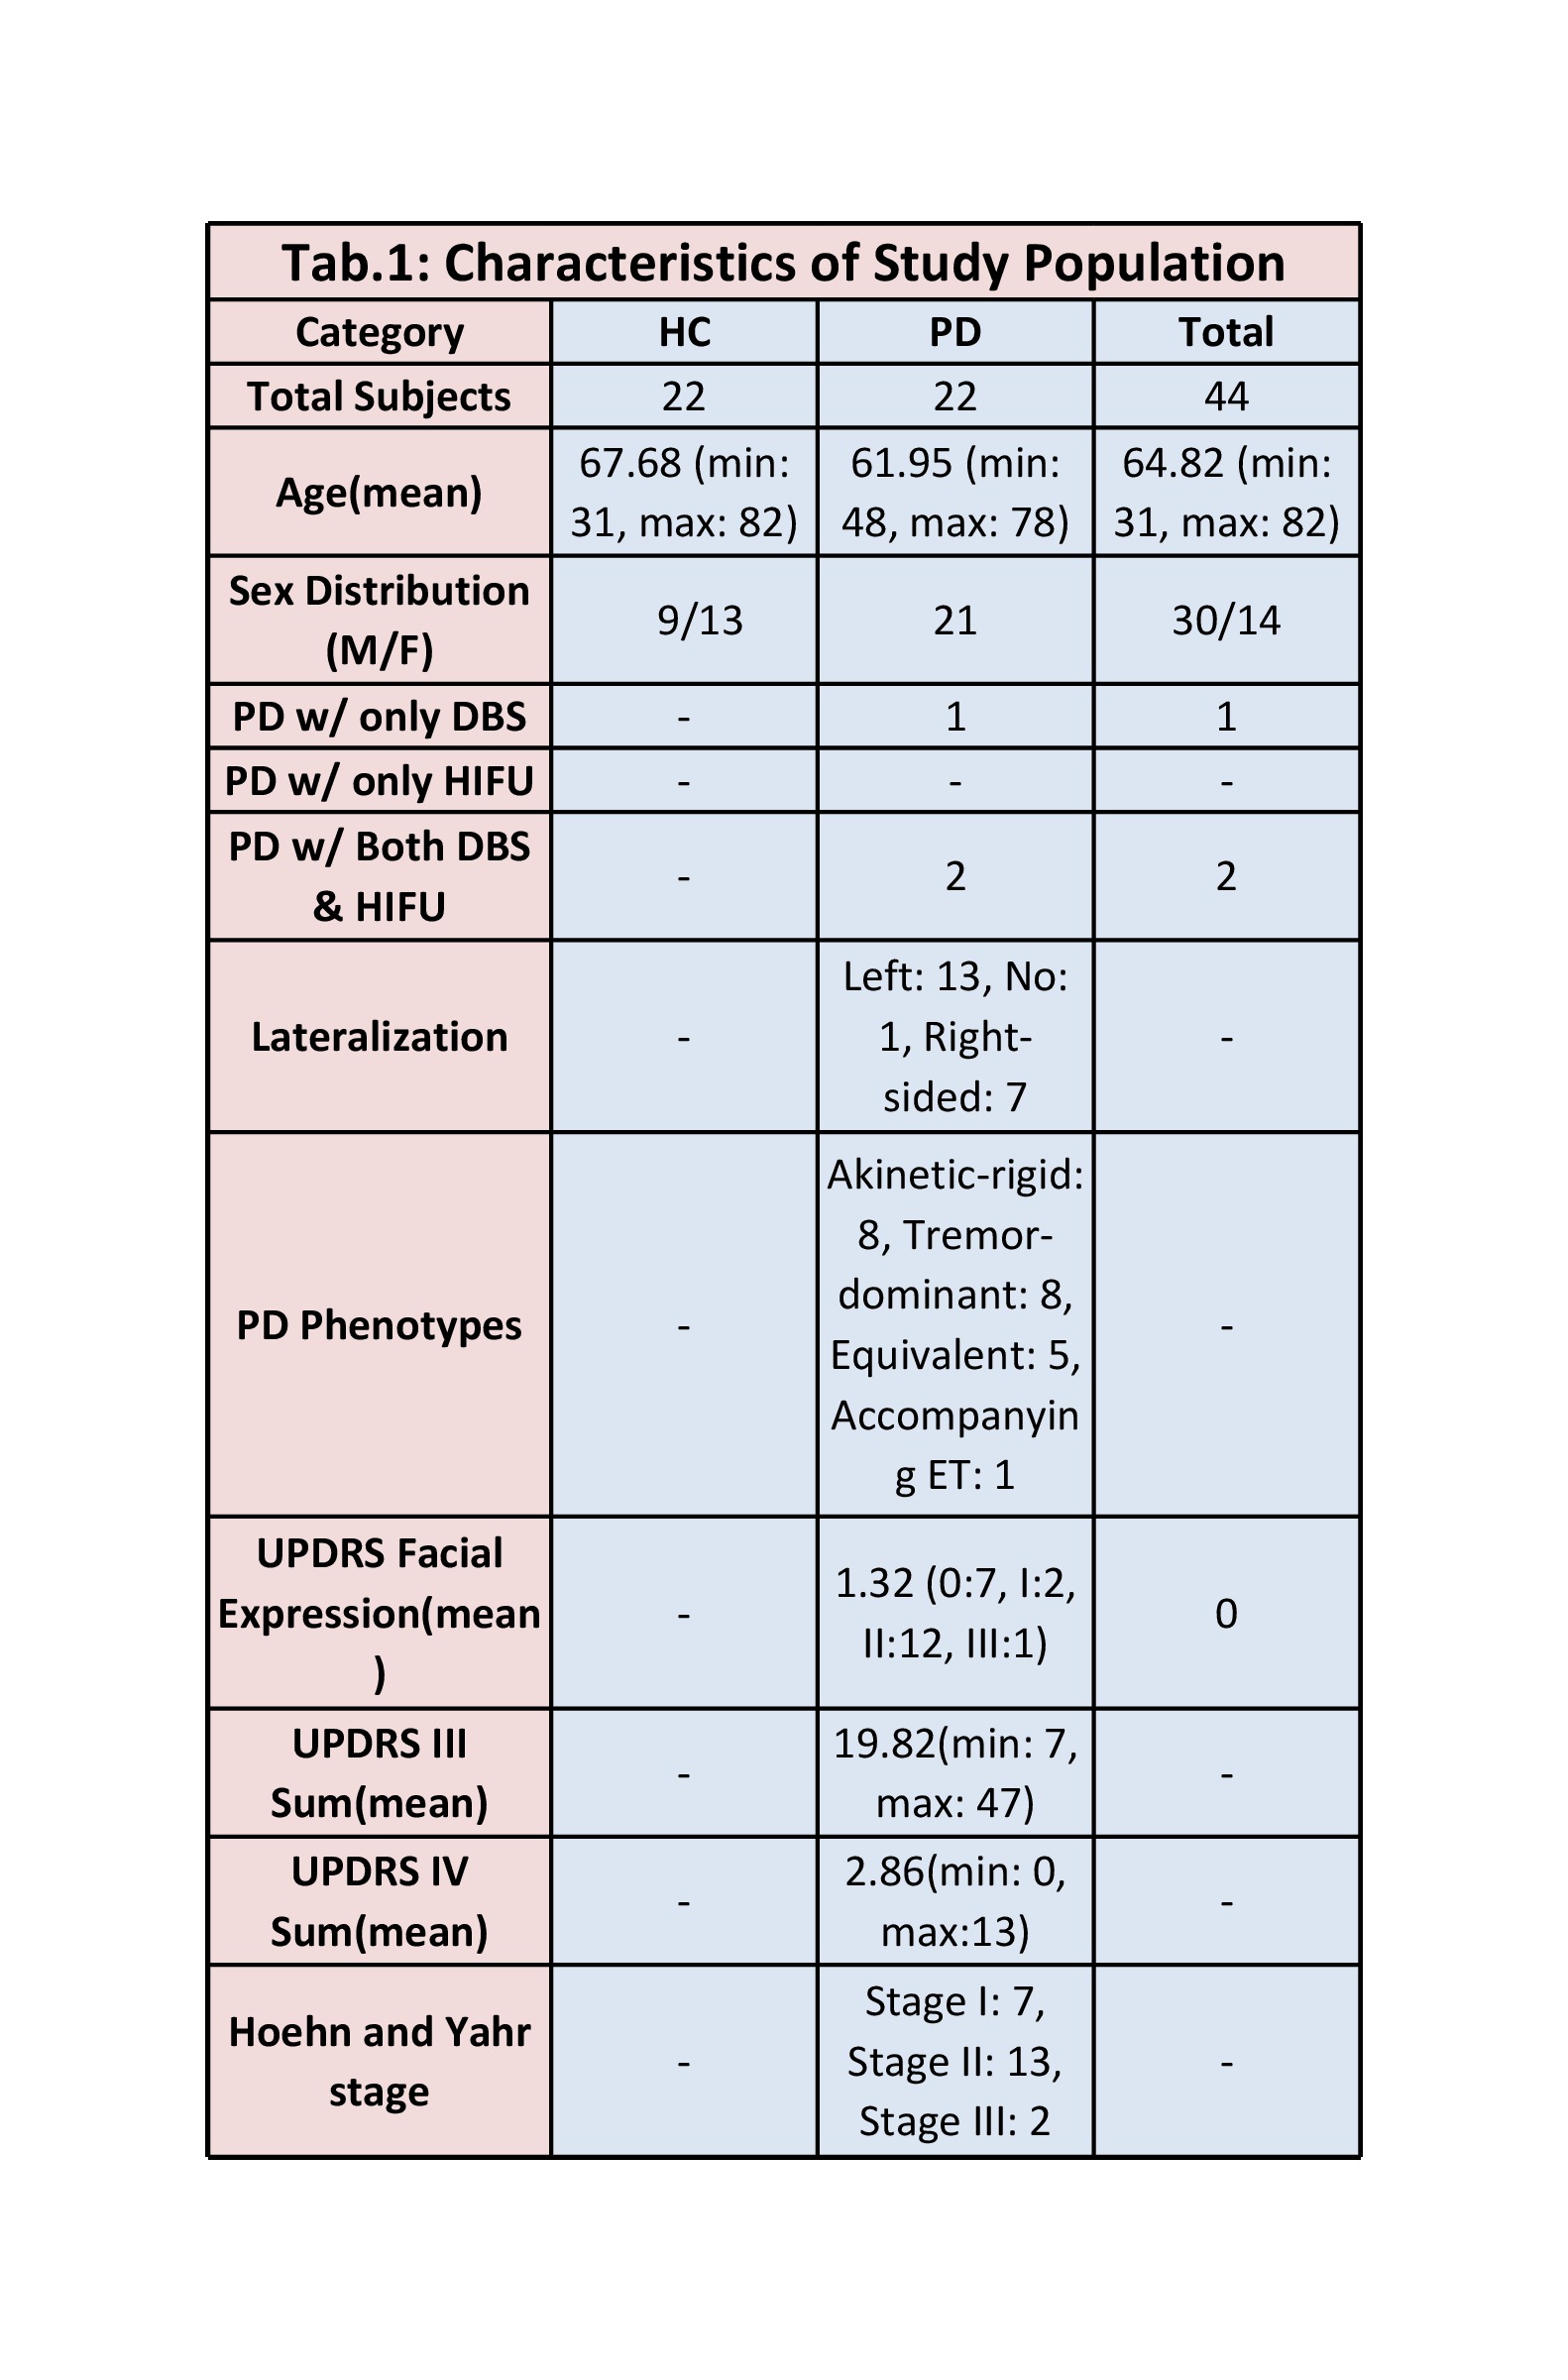
Tab.1: Characteristics of Study Population
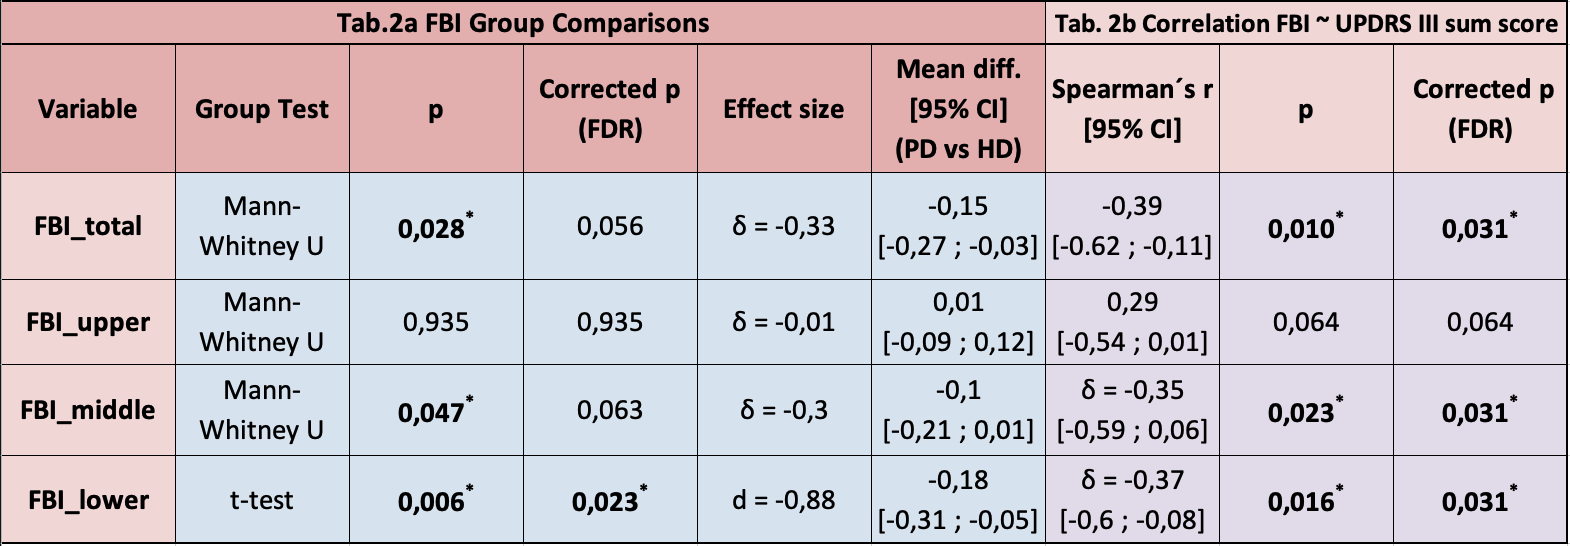
Tab.2 FBI Group Comparisons and Correlations
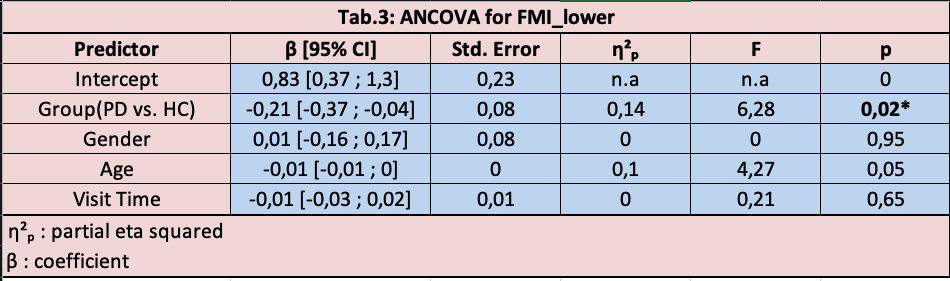
Tab.3: ANCOVA for FMI lower
References: 1. Menzel, T.B., Mario; Latoschick, Marc Erich, Automated Blendshape Personalization for Faithful Face Animations Using Commodity Smartphones | Proceedings of the 28th ACM Symposium on Virtual Reality Software and Technology. Proceedings of the 28th ACM Symposium on Virtual Reality Software and Technology, 2022.
2. Postuma, R.B., et al., How does parkinsonism start? Prodromal parkinsonism motor changes in idiopathic REM sleep behaviour disorder. Brain, 2012/06/01. 135(6).
3. FitzGerald, J.J., et al., Frontiers | Quantifying Motor Impairment in Movement Disorders. Frontiers in Neuroscience, 2018/04/11. 12.
4. Pegolo, E., et al., Quantitative Evaluation of Hypomimia in Parkinson’s Disease: A Face Tracking Approach. Sensors 2022, Vol. 22, Page 1358, 2022-02-10. 22(4).
To cite this abstract in AMA style:
B. Koyak, T. Menzel, M. Botsch, A. Spottke, M. Reuter, U. Wüllner, NA. Aziz. Facial Blendshape Index(FBI) for Quantification of Hypomimia on Parkinson´s Disease [abstract]. Mov Disord. 2025; 40 (suppl 1). https://www.mdsabstracts.org/abstract/facial-blendshape-indexfbi-for-quantification-of-hypomimia-on-parkinsons-disease/. Accessed July 5, 2026.« Back to 2025 International Congress
MDS Abstracts - https://www.mdsabstracts.org/abstract/facial-blendshape-indexfbi-for-quantification-of-hypomimia-on-parkinsons-disease/