Objective: To compare lateral stability during gait in people with Parkinson’s Disease (PD), compared to healthy controls (HC).
Background: PD is a progressive neurodegenerative disorder[1], characterized by an increased risk of falling during gait[2]. Impaired lateral stability, measured by the interaction between the COM and the COP[3], has been observed in different neurological populations[4]; however, this interaction has poorly been studied in subjects with PD.
Method: Subjects with PD and HC walked at a comfortable speed on a linear path. A Motion Capture system (Qualisys) with 10 infrared cameras and two force platforms (AMTI) was used to collect data on the spatiotemporal characteristics of the COP. COM was computed by first determining the center of mass of each segment and then calculating the center of mass across all of the model’s segments. The minimum and maximum lateral distances between COM and COP [Figure1], normalized to each subject’s height, were collected. Additionally, the maximum lateral COM velocity was computed and normalized to gait speed. All variables were averaged and compared between groups. Pearson’s correlation coefficient was used to assess the relationship between lateral COM-COP distances and normalized COM velocity.
Results: No significant differences between groups were found in the minimum and maximum lateral distances between COM and COP [Figure2]. However, individuals with PD exhibited a significant increase in lateral COM velocity (MD: 0.04; 95% CI: 0.01, 0.07; p = 0.03). A strong correlation between the minimum distance and lateral velocity (PD= r:0.837; p<0.001; HC= r:0.868; p=0.001) was identified in both groups [Figure4]. Additionally, a strong linear correlation between the maximum distance and lateral velocity was found only in the PD group (r=0.865; p<0.001) [Figure5].
Conclusion: Stability in the frontal plane during gait is impaired in PD, with an increase in the lateral velocity of the COM. Moreover, COM lateral oscillations appear to behave differently in PD, with increasing lateral velocity corresponding to greater minimum and maximum COM and COP distances. Further studies are needed to validate theoretical models and assess the effectiveness of strategies based on COM-COP interactions.
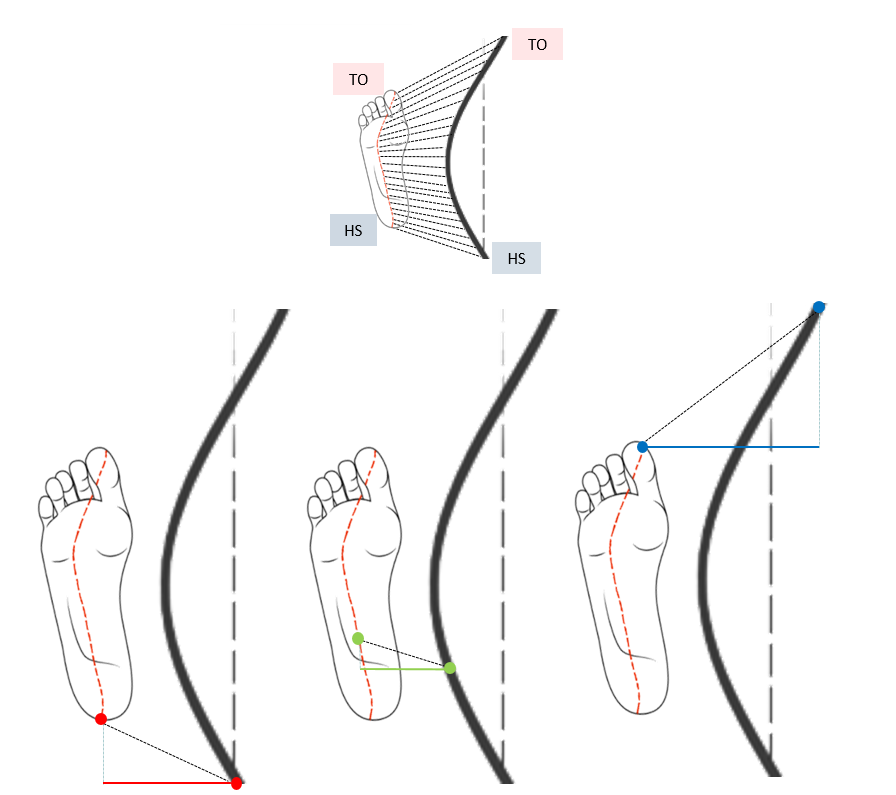
Lateral Distance between COM and COP
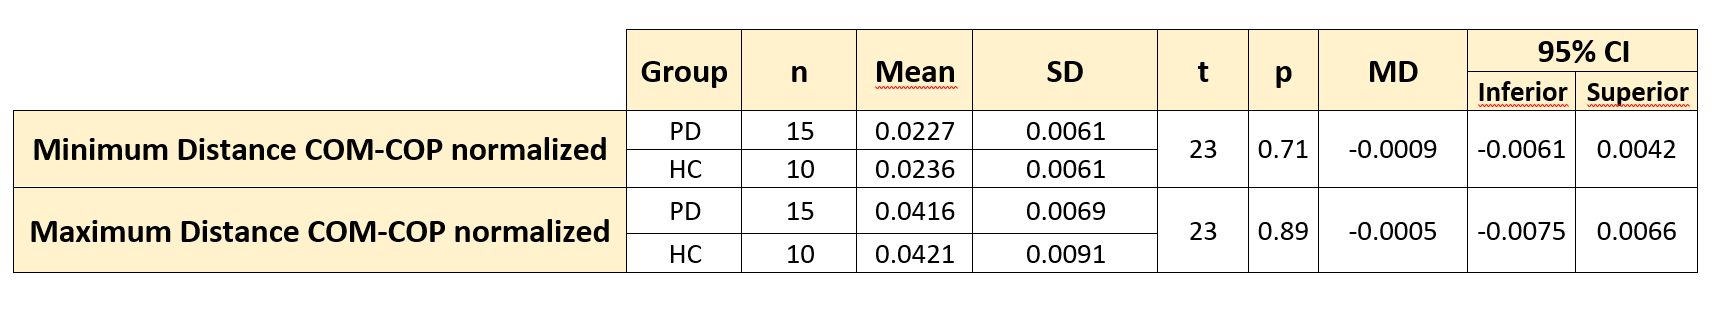
COM-COP distance: comparisons between groups
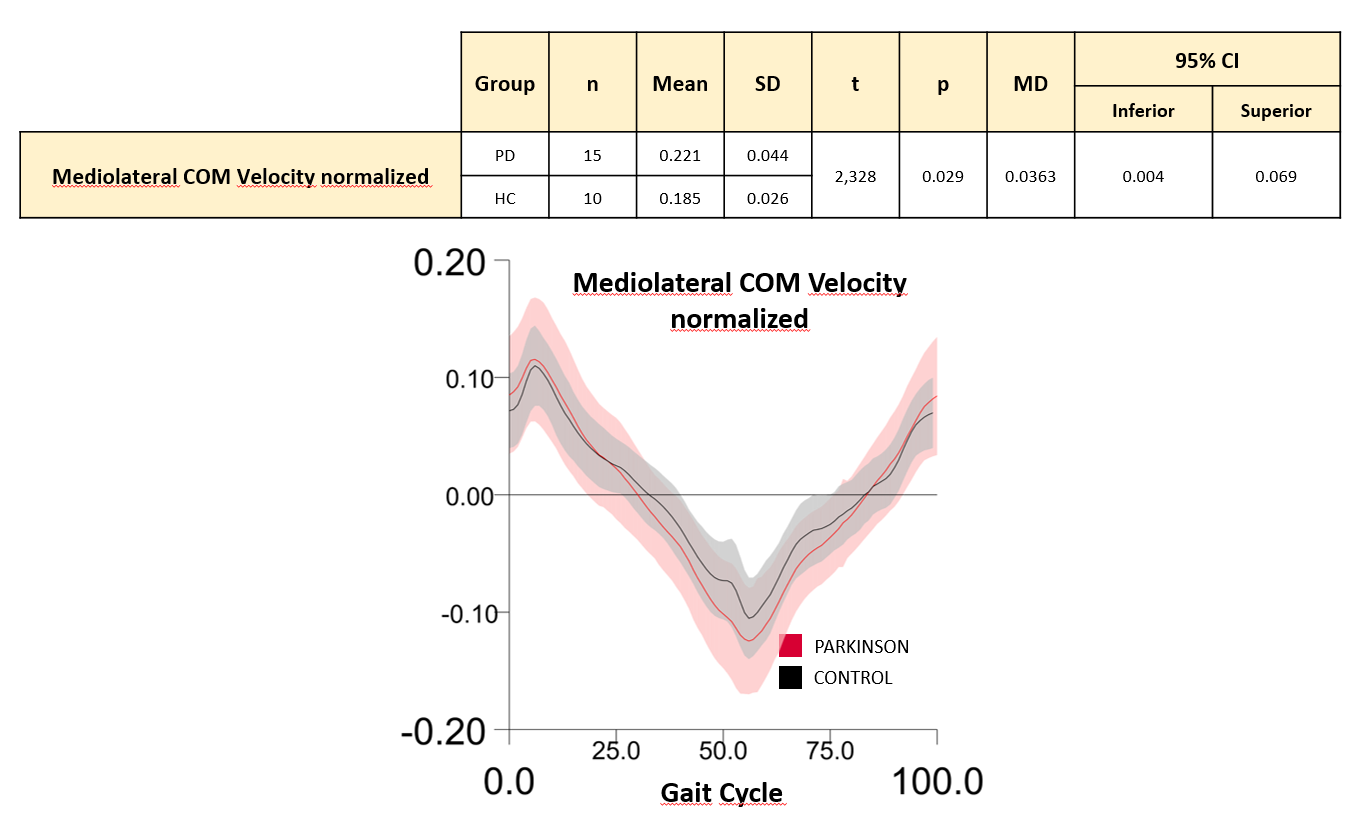
Lateral COM velocity: comparison between groups
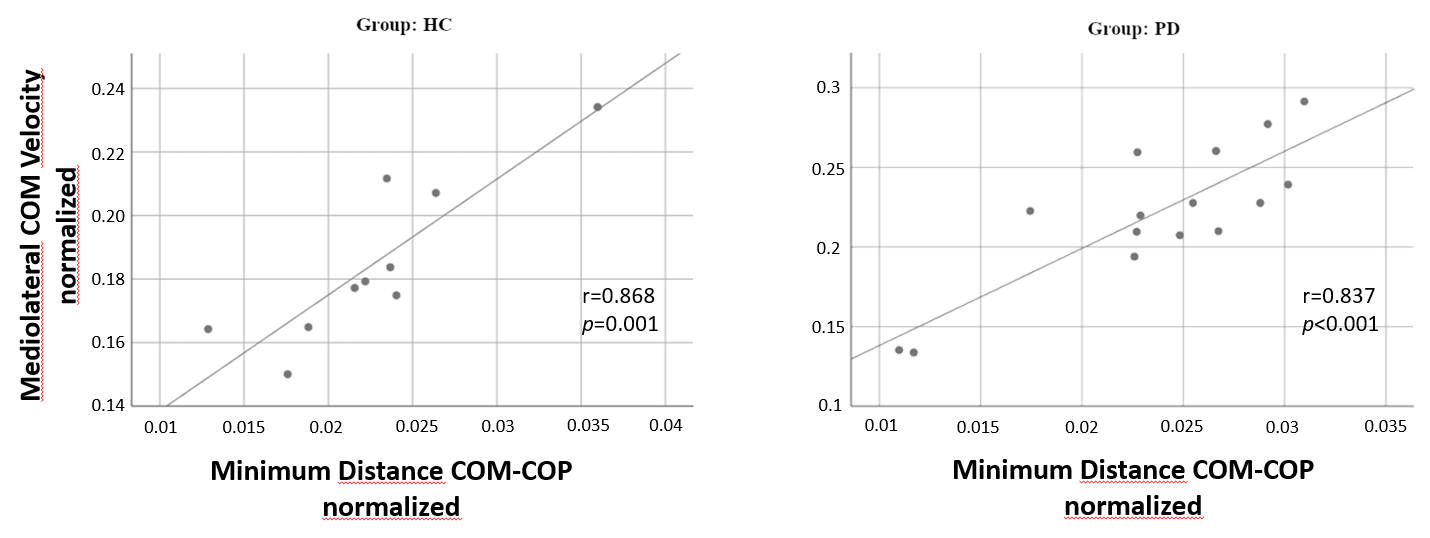
COM Velocity and Minimum Distance Correlations
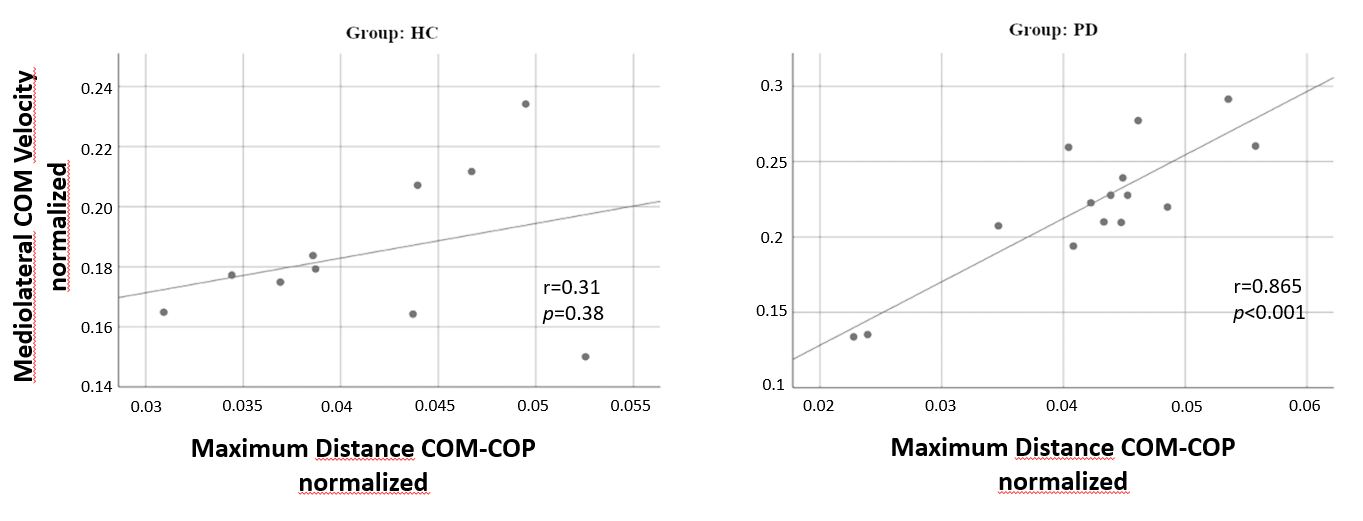
COM Velocity and Maximum Distance Correlations
References: 1. Jankovic, J., & Tan, E.K. (2020). Parkinson’s disease: etiopathogenesis and treatment. Journal of Neurology, Neurosurgery & Psychiatry, 91(8), 795-808. https://doi.org/ 10.1136/jnnp-2019-322338.
2. Bloem, B. R., Grimbergen, Y. A., Cramer, M., Willemsen, M., & Zwinderman, A. H. (2001). Prospective assessment of falls in Parkinson’s disease. Journal of neurology, 248(11), 950–958. https://doi.org/10.1007/s004150170047.
3. Lugade, V., Lin, V., & Chou, L. S. (2011). Center of mass and base of support interaction during gait. Gait & posture, 33(3), 406-411. https://doi.org/10.1016/j.gaitpost.2010.12.013.
4. Kimoto M, Okada K, Mitobe K, Saito M, Kawanobe U, Sakamoto H. Analysis of center of mass and center of pressure displacement in the transverse plane during gait termination in children with cerebral palsy. Gait Posture. 2021;90:106-111. doi:10.1016/j.gaitpost.2021.07.015
To cite this abstract in AMA style:
D. Tosatto, D. Bonacina, F. D'Andrea, C. Perin, C. Alessandro, D. Piscitelli. Center of Mass and Center of Pressure interactions during Gait in people with Parkinson’s Disease [abstract]. Mov Disord. 2025; 40 (suppl 1). https://www.mdsabstracts.org/abstract/center-of-mass-and-center-of-pressure-interactions-during-gait-in-people-with-parkinsons-disease/. Accessed April 10, 2026.« Back to 2025 International Congress
MDS Abstracts - https://www.mdsabstracts.org/abstract/center-of-mass-and-center-of-pressure-interactions-during-gait-in-people-with-parkinsons-disease/