Objective: To determine the faller rate across years since diagnosis and neuronal α-synuclein disease integrated staging system (NSD-ISS) stages in the Parkinson’s Progression Markers Initiative (PPMI)
Background: Fall frequency is high in people with Parkinson’s (PwP): 60% fall at least once [1], and 9-10% transition from non-faller to faller status annually [2]. However, fall frequency over time is unknown.
Method: We included Parkinson’s disease (PD), prodromal, and healthy controls from the PPMI December 2024 release. Self-reported falls were assessed using items 13 and 14 of the Unified Parkinson’s Disease Rating Scale – part II, which were introduced to the PPMI in 2019. Item 13 describes falls unrelated to freezing, while item 14 describes falls related to freezing of gait, in the past year. A fall was defined as ≥ 1 in item 13 or ≥3 in item 14. In PD, we calculated the percentage of participants with a fall across years since disease diagnosis and rounded it to the nearest integer. The NSD-ISS establishes a staging system based on biological anchors (i.e., S, presence of pathological neuronal α-synuclein species detected in vivo and D, dopaminergic neuronal dysfunction) and the degree of functional impairment caused by clinical signs or symptoms [3]. Stages 0-1 are asymptomatic and are defined by the presence of pathogenic variants in the SNCA gene (stage 0), S alone (stage 1A), or S and D (stage 1B). The presence of clinical manifestations marks the transition to stage 2, while stage 3 and beyond are marked by increasing degrees of functional impairment (e.g., stage 3, slight; stage 4, mild; stage 5, moderate; stage 6, severe) [3]. NSD-ISS was calculated during yearly visits. We calculated the percentage of participants with at least one fall per year across NSD-ISS. All missing fall and NSD-ISS data were excluded from the analyses.
Results: We included 3,172 and 2,517 visits with falls data in the PD and NSD-ISS analyses, respectively. The percentage of PwP with ≥ 1 falls at year zero, year five, and year 10 since diagnosis was 15%, 28%, and 46%, respectively [Figure 1]. Fall percentage by NSD-ISS was 0%, 9%, 23%, 48%, 80%, and 92% at stages 2a, 2b, 3, 4, 5, and 6, respectively [Figure 2].
Conclusion: The percentage of PPMI participants with ≥ 1 yearly fall increased with both years since disease diagnosis and higher NSD-ISS. Nearly half of PwP reported ≥ 1 yearly fall by year 10 since diagnosis and at NSD-ISS stage 4.
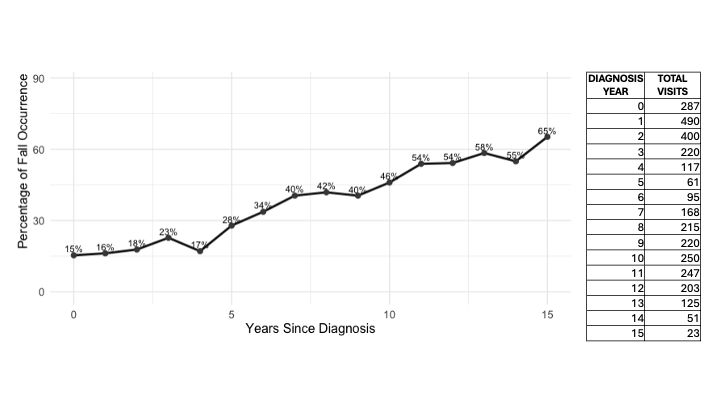
Figure 1
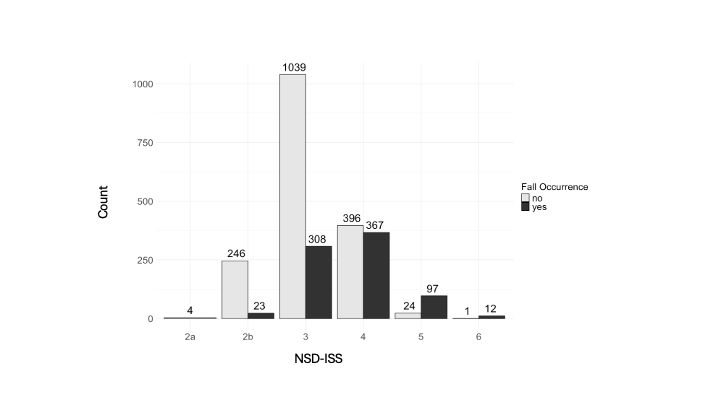
Figure 2
References: 1. Pelicioni PHS, Menant JC, Latt MD, Lord SR. Falls in Parkinson’s Disease Subtypes: Risk Factors, Locations and Circumstances. Int J Environ Res Public Health 2019;16(12):2216.
2. Parashos SA, Bloem BR, Browner NM, et al. What predicts falls in Parkinson disease?: Observations from the Parkinson’s Foundation registry. Neurol Clin Pract. 2018 Jun;8(3):214-222.
3. Simuni T, Chahine LM, Poston K, et al. A biological definition of neuronal α-synuclein disease: towards an integrated staging system for research. Lancet Neurol. 2024 Feb;23(2):178-190.
To cite this abstract in AMA style:
J. Vizcarra, D. Lafontant, A. Siderowf. Frequency of Falls in the Parkinson’s Progression Markers Initiative [abstract]. Mov Disord. 2025; 40 (suppl 1). https://www.mdsabstracts.org/abstract/frequency-of-falls-in-the-parkinsons-progression-markers-initiative/. Accessed April 10, 2026.« Back to 2025 International Congress
MDS Abstracts - https://www.mdsabstracts.org/abstract/frequency-of-falls-in-the-parkinsons-progression-markers-initiative/