Category: Parkinson's disease: Neuroimaging
Objective: To compare regional binding patterns of microglial PET radioligands: [11C]DPA-713, a TSPO ligand, and [11C]CPPC1, a CSF1R ligand in people with Parkinson’s disease (PD).
Background: Proliferation and/or activation of brain microglia is involved in the cascade of pathological events in PD2. In vivo imaging of microglia has targeted TSPO, but this is expressed in multiple cell types and may not represent activation3. The colony stimulating factor-1 receptor (CSF1R) may offer more microglial-specific imaging.
Method: 12 people with PD between age 50 and 80 with Hoehn and Yahr <2.5 and disease duration <2 years, 9 healthy controls, and 11 people with REM behavior disorder (RBD) had a 90 min dynamic PET scan after a bolus of 20 mCi of the CSF1R radioligand [11C]CPPC. Of these, 6 people with PD, 8 with RBD, and 6 healthy controls also had a [11C]DPA-713 PET. All participants underwent MDS-UPDRS testing. After MRI-PET, co-registration and motion correction, MRI was segmented using MRI Cloud for cortical and subcortical regions. The metabolite-correct total distribution volume (VT) was calculated using Logan graphical analysis. Regional VT was compared between control, RBD, and PD groups both for [11C]CPPC and [11C]DPA-713 (adjusted for affinity genotype) and in the PD group, correlated with MDS-UPDRS Part II and Part III. Regional VT values from both [11C]CPPC and [11C]DPA-713 were also compared with Pearson correlation.
Results: [11C]CPPC VT tended to be higher in people with PD compared to those with RBD and healthy controls while [11C]DPA-713 binding overlapped between PD and RBD but both tended to be higher than controls (Figure 1). In people with PD, [11C]CPPC VT correlated with MDS-UPDRS part 2 in the putamen (r=0.66, p=0.019, Figure 2), midbrain (r=0.76, p=0.005), and other regions but [11C]DPA-713 VT did not correlate with MDS-UPDRS part 2 in any region. MDS-UPDRS part 3 was not statistically significantly correlated with either tracer in any region but [11C]CPPC showed a trend for positive correlation in the putamen (r=0.48, p=0.11), midbrain (r=0.46, p=0.13), and the globus pallidus (r=0.55, p=0.06). [11C]CPPC and [11C]DPA VT did not correlate in any region.
Conclusion: TSPO and CSF1R PET imaging may capture different aspects of microglial proliferation and/or activation, and the latter may correlate with disease severity in early PD while the former is elevated in both RBD and PD.
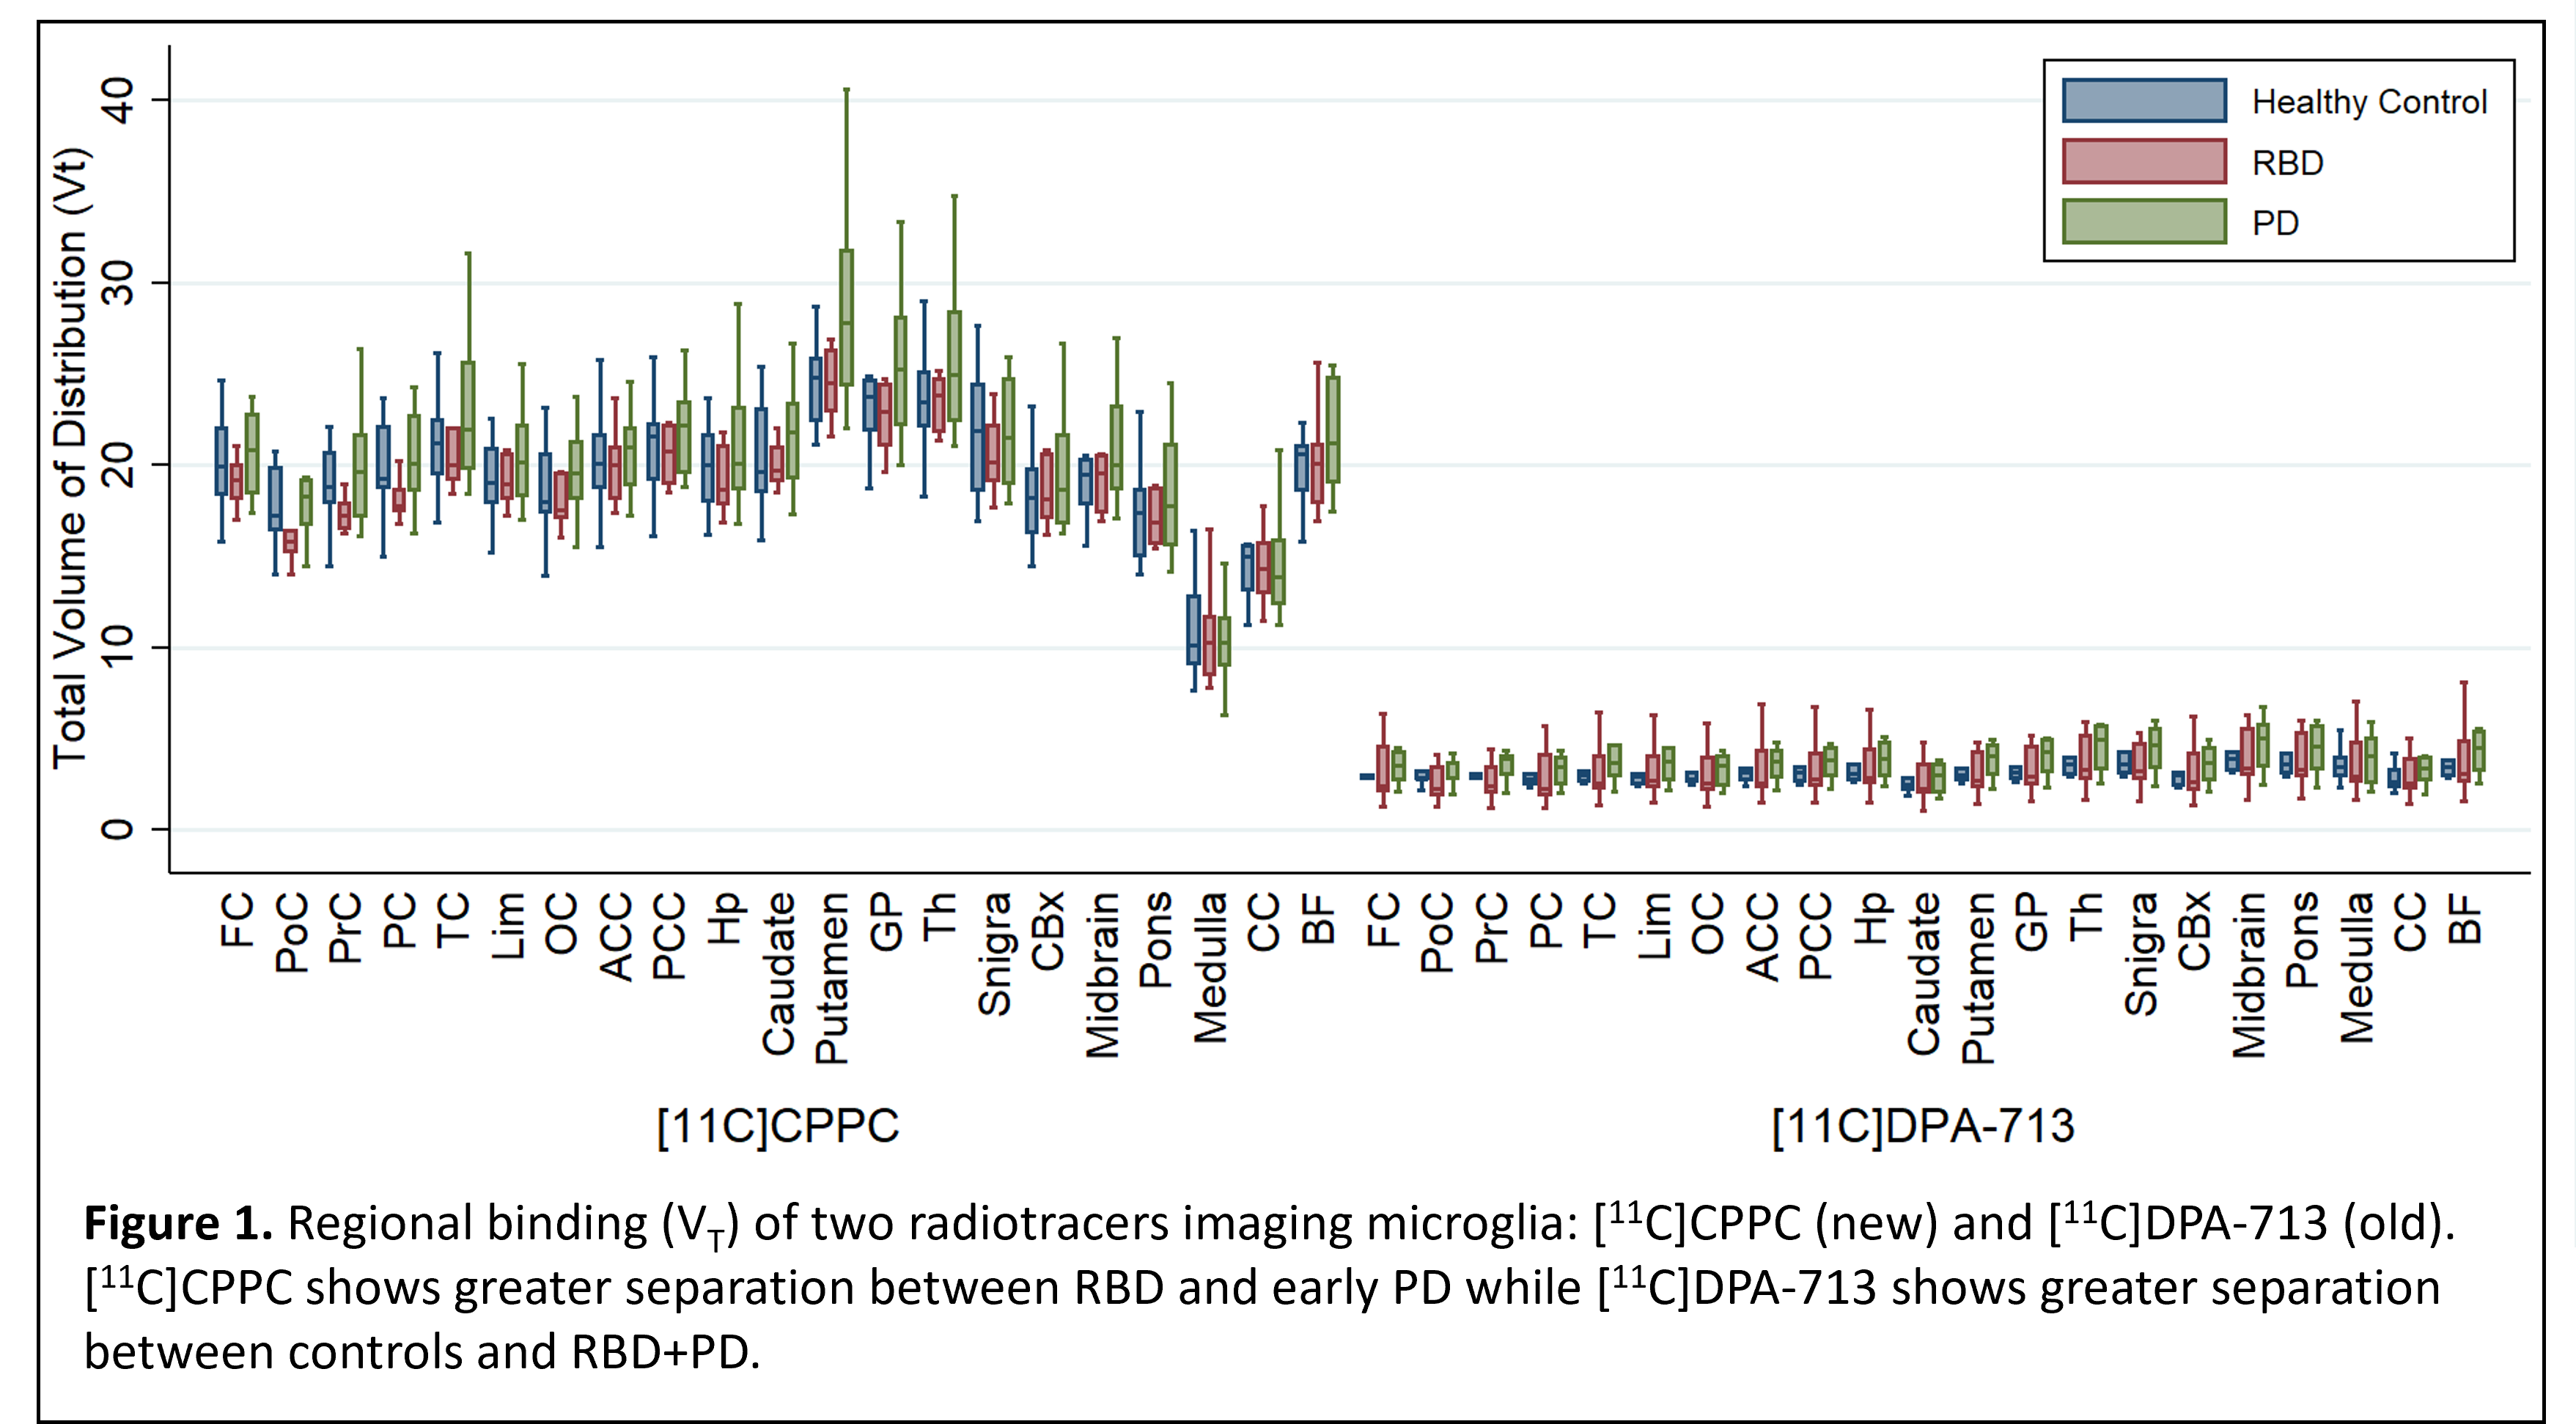
Figure 1
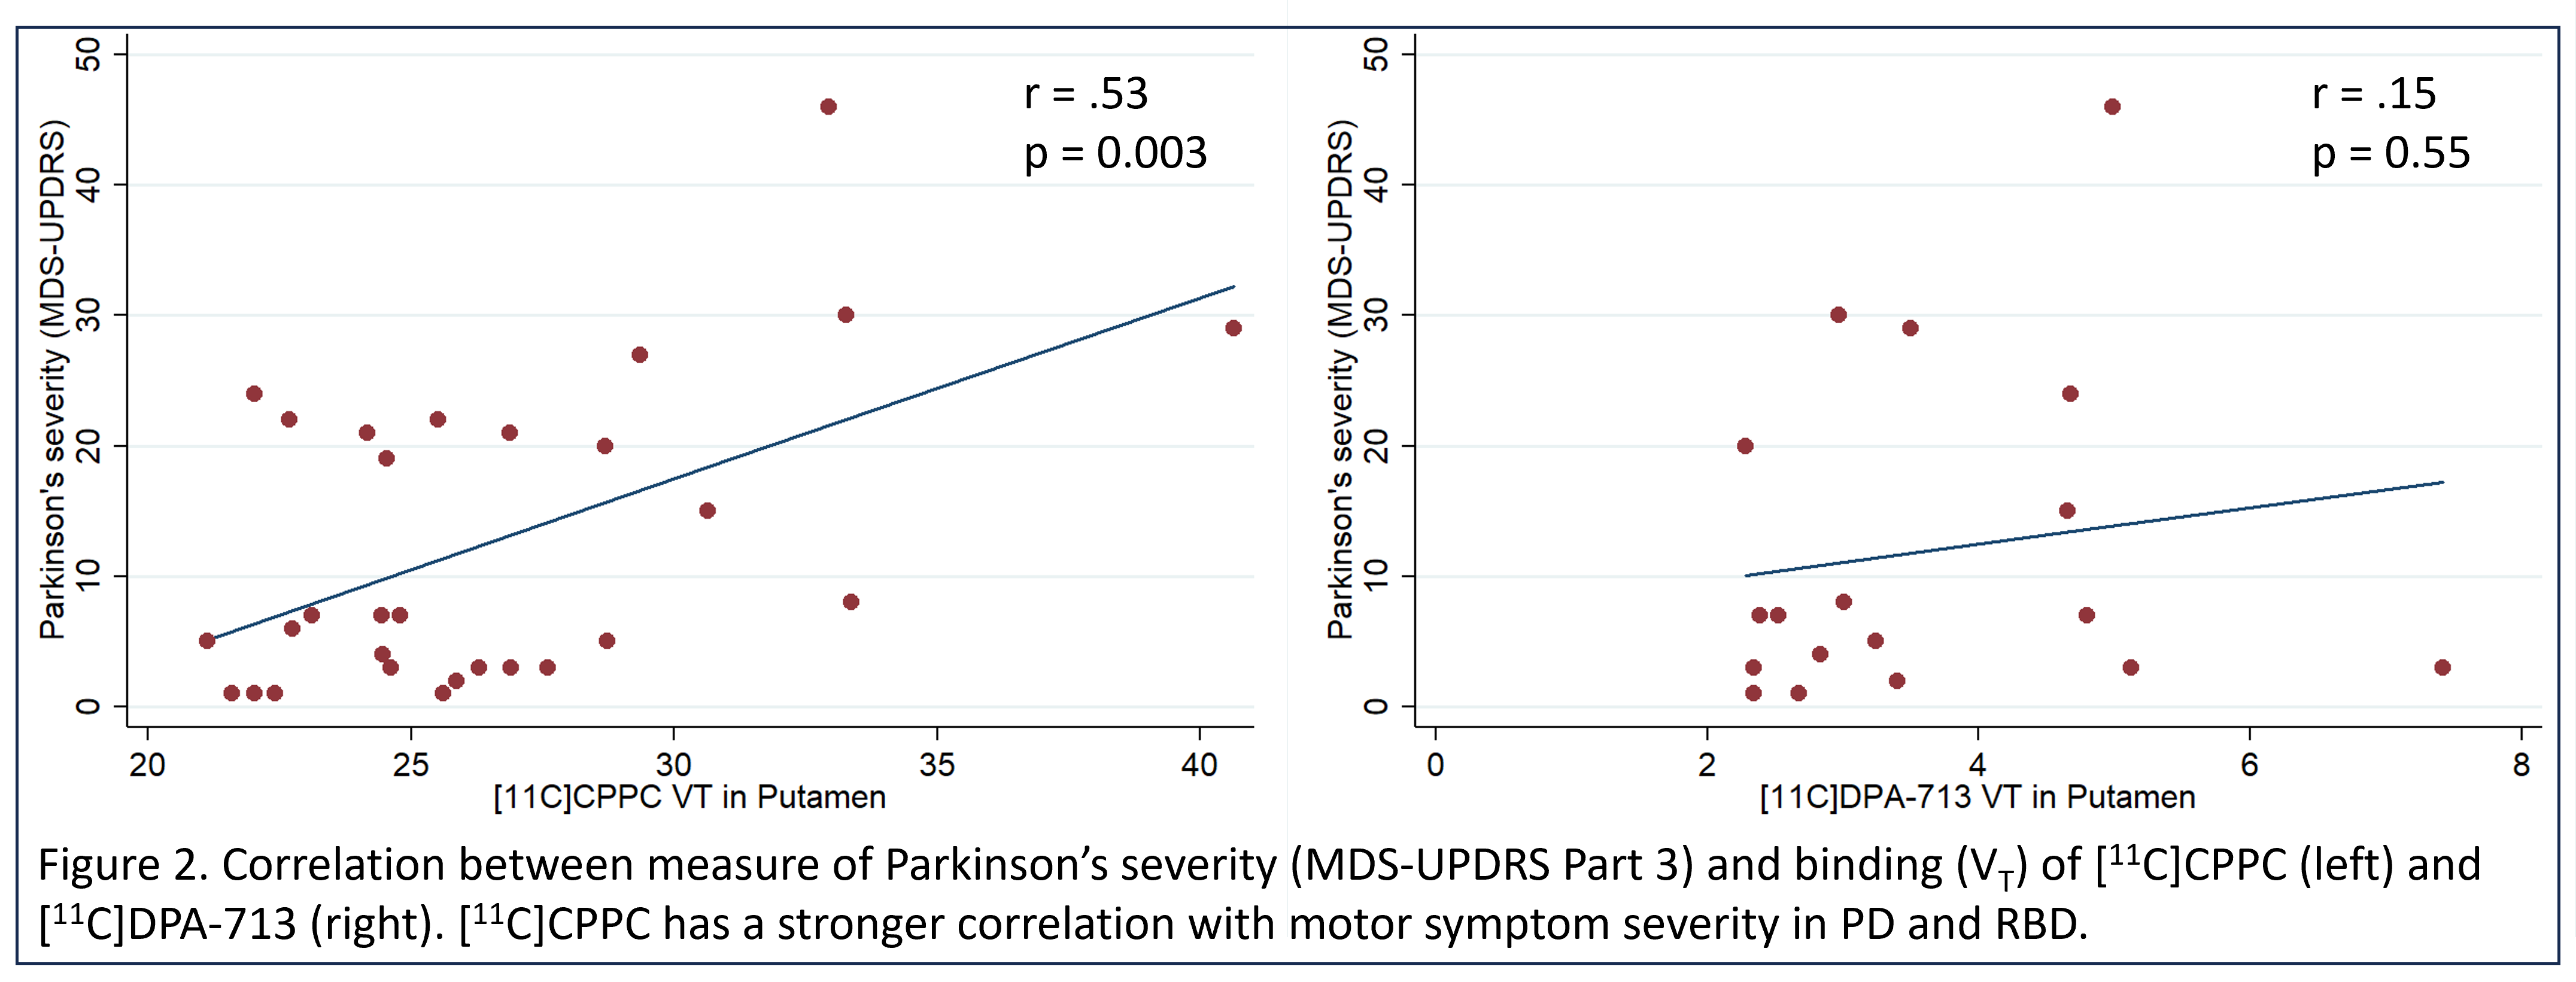
Figure 2
References: 1 Horti, A. G. et al. PET imaging of microglia by targeting macrophage colony-stimulating factor 1 receptor (CSF1R). Proc. Natl. Acad. Sci. U. S. A. 116, 1686-1691, doi:10.1073/pnas.1812155116 (2019).
2 Liddelow, S. A. et al. Neurotoxic reactive astrocytes are induced by activated microglia. Nature 541, 481-487, doi:10.1038/nature21029 (2017).
3 Nutma, E. et al. Translocator protein is a marker of activated microglia in rodent models but not human neurodegenerative diseases. Nature communications 14, 5247, doi:10.1038/s41467-023-40937-z (2023).
To cite this abstract in AMA style:
K. Mills, I. Cheong, Y. Du, J. Coughlin, A. Horti, C. Motley, R. Dannals, W. Lesniak, T. Dawson, M. Pomper. Comparison of Microglial PET Imaging in Parkinson’s Disease, RBD, and Controls with a CSF1R and TSPO Ligand. [abstract]. Mov Disord. 2025; 40 (suppl 1). https://www.mdsabstracts.org/abstract/comparison-of-microglial-pet-imaging-in-parkinsons-disease-rbd-and-controls-with-a-csf1r-and-tspo-ligand/. Accessed July 7, 2026.« Back to 2025 International Congress
MDS Abstracts - https://www.mdsabstracts.org/abstract/comparison-of-microglial-pet-imaging-in-parkinsons-disease-rbd-and-controls-with-a-csf1r-and-tspo-ligand/