Category: MSA, PSP, CBS: Disease Mechanisms
Objective: To investigate the gene expression and neurobiological underpinnings of brain atrophy in MSA using imaging transcriptomics and PET-based molecular annotation
Background: The biological mechanisms underlying multiple system atrophy (MSA) remain poorly understood. Imaging transcriptomics is a novel method enabling the investigation of the relationships between brain anatomy and the transcriptional activity of genes.1,2 Spatial mapping annotation approaches allow the investigation of the spatial resemblance between brain patterns and specific density maps from individual receptors.3
Method: We derived brain atrophy measurements from the T1-w MRI scans of 65 patients with MSA and 181 age- and sex-matched healthy controls. Using postmortem data from the Allen Human Brain Atlas,4 partial least square (PLS) regression was used to identify gene expression components associated with atrophy. Gene enrichment analyses were performed to investigate the biological processes with enriched genes in regions showing atrophy. To test whether the gene enrichment patterns in MSA were disease-specific, we replicated the same analysis on a sample of 57 patients with Parkinson’s disease (PD) (Fig1). PET-based annotation mapping was used to identify the neurochemical systems whose density maps matched atrophy.
Results: Atrophy was found mainly in deep brain regions, including the cerebellar white matter, pons, putamen, olive nuclei, and substantia nigra (Fig2). PLS regression on deep brain region atrophy identified two gene expression latent variables, explaining 27.5% of the covariance. Regions with greater atrophy overexpressed genes related to the mitochondrial respiratory chain, particularly proton transmembrane transport and complex I assembly (Fig3). Cell type analysis revealed that regions with atrophy overexpressed genes related to oligodendrocytes. These patterns were distinct from those found in Parkinson’s disease. PET-based annotation mapping analysis showed that atrophic regions had lower density of serotonin receptors and GABA receptors, as well as a higher density of acetylcholine and noradrenaline transporters (Fig4).
Conclusion: Atrophic regions show specific features, namely overexpression of genes related to mitochondrial function, oligodendrocytes, and distinct neurochemical patterns. This study highlights some of the biological and neurochemical mechanisms underlying selective vulnerability of brain regions in MSA.
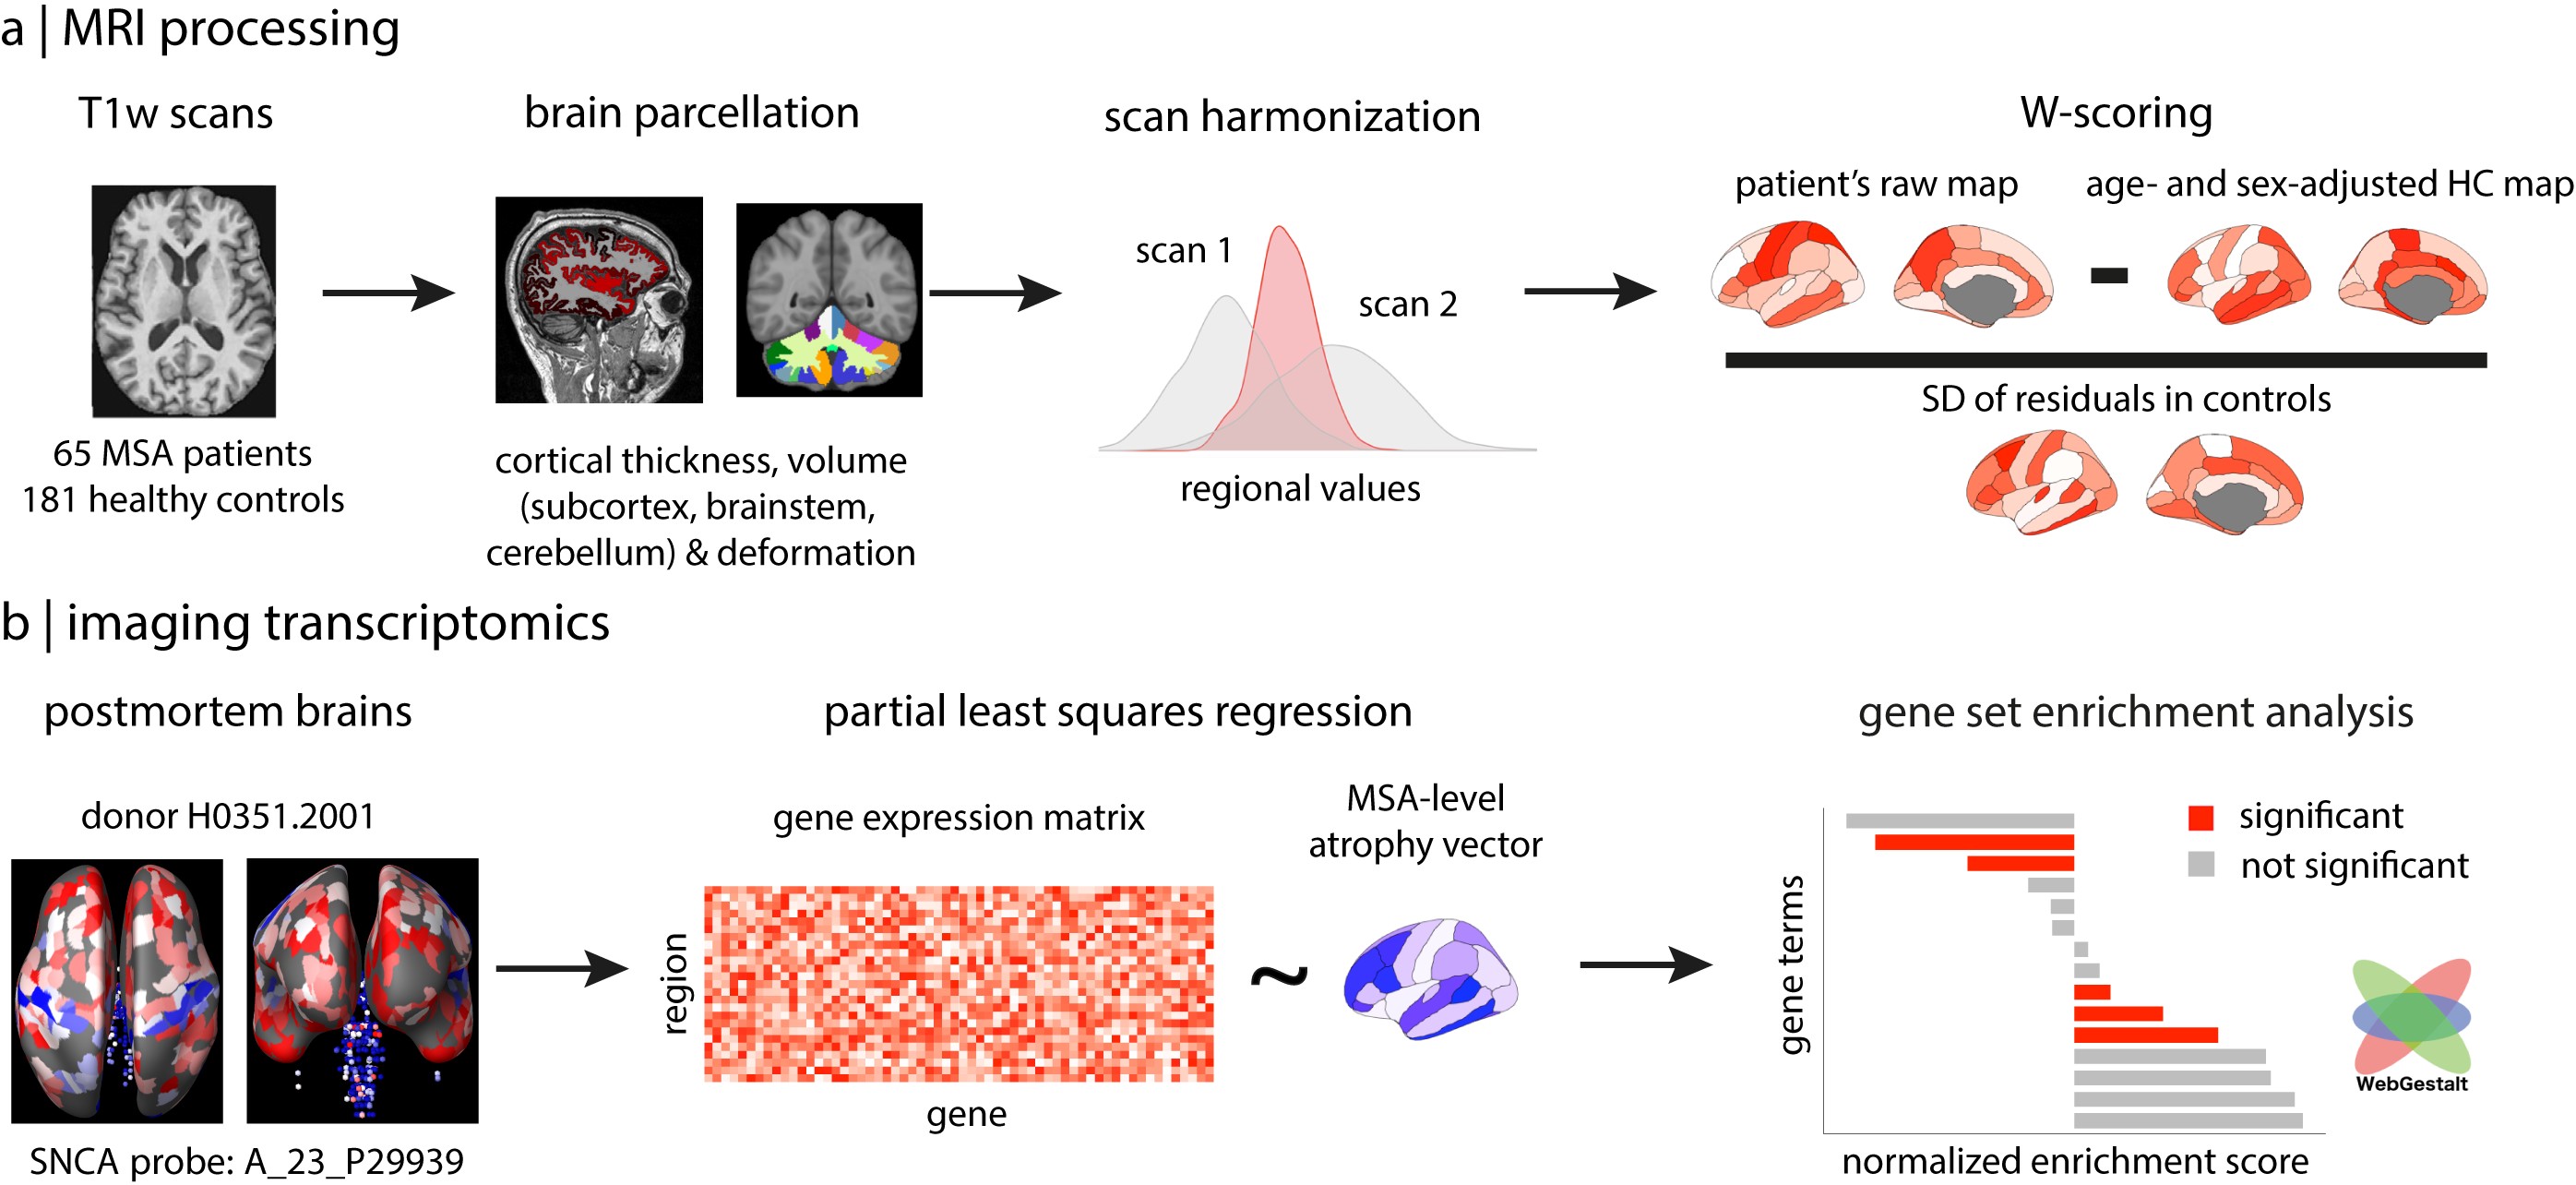
Analysis workflow
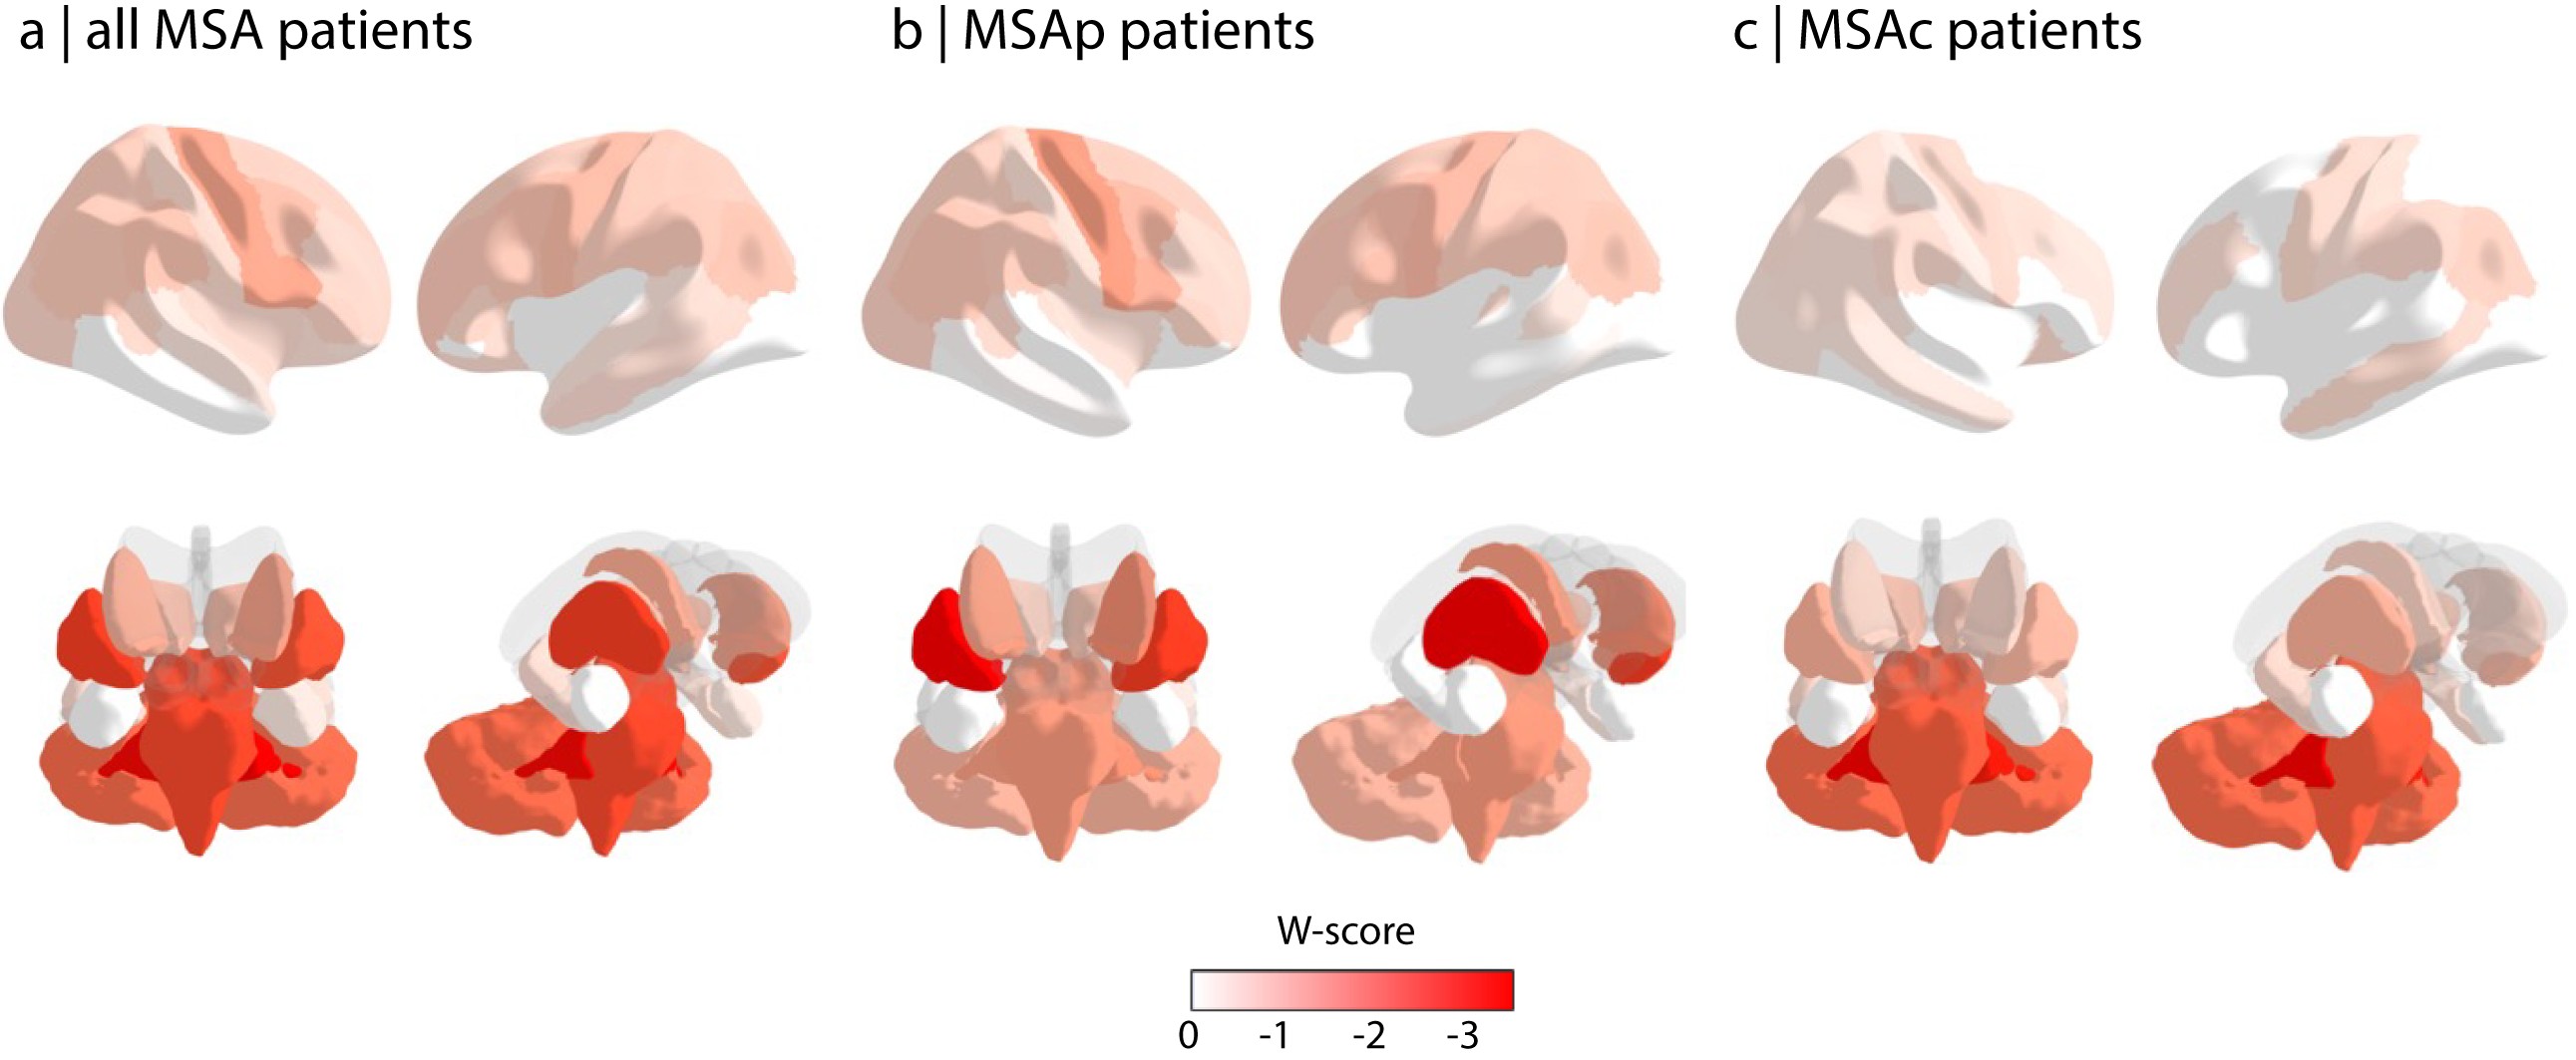
Pattern of cortical and subcortical atrophy in MSA
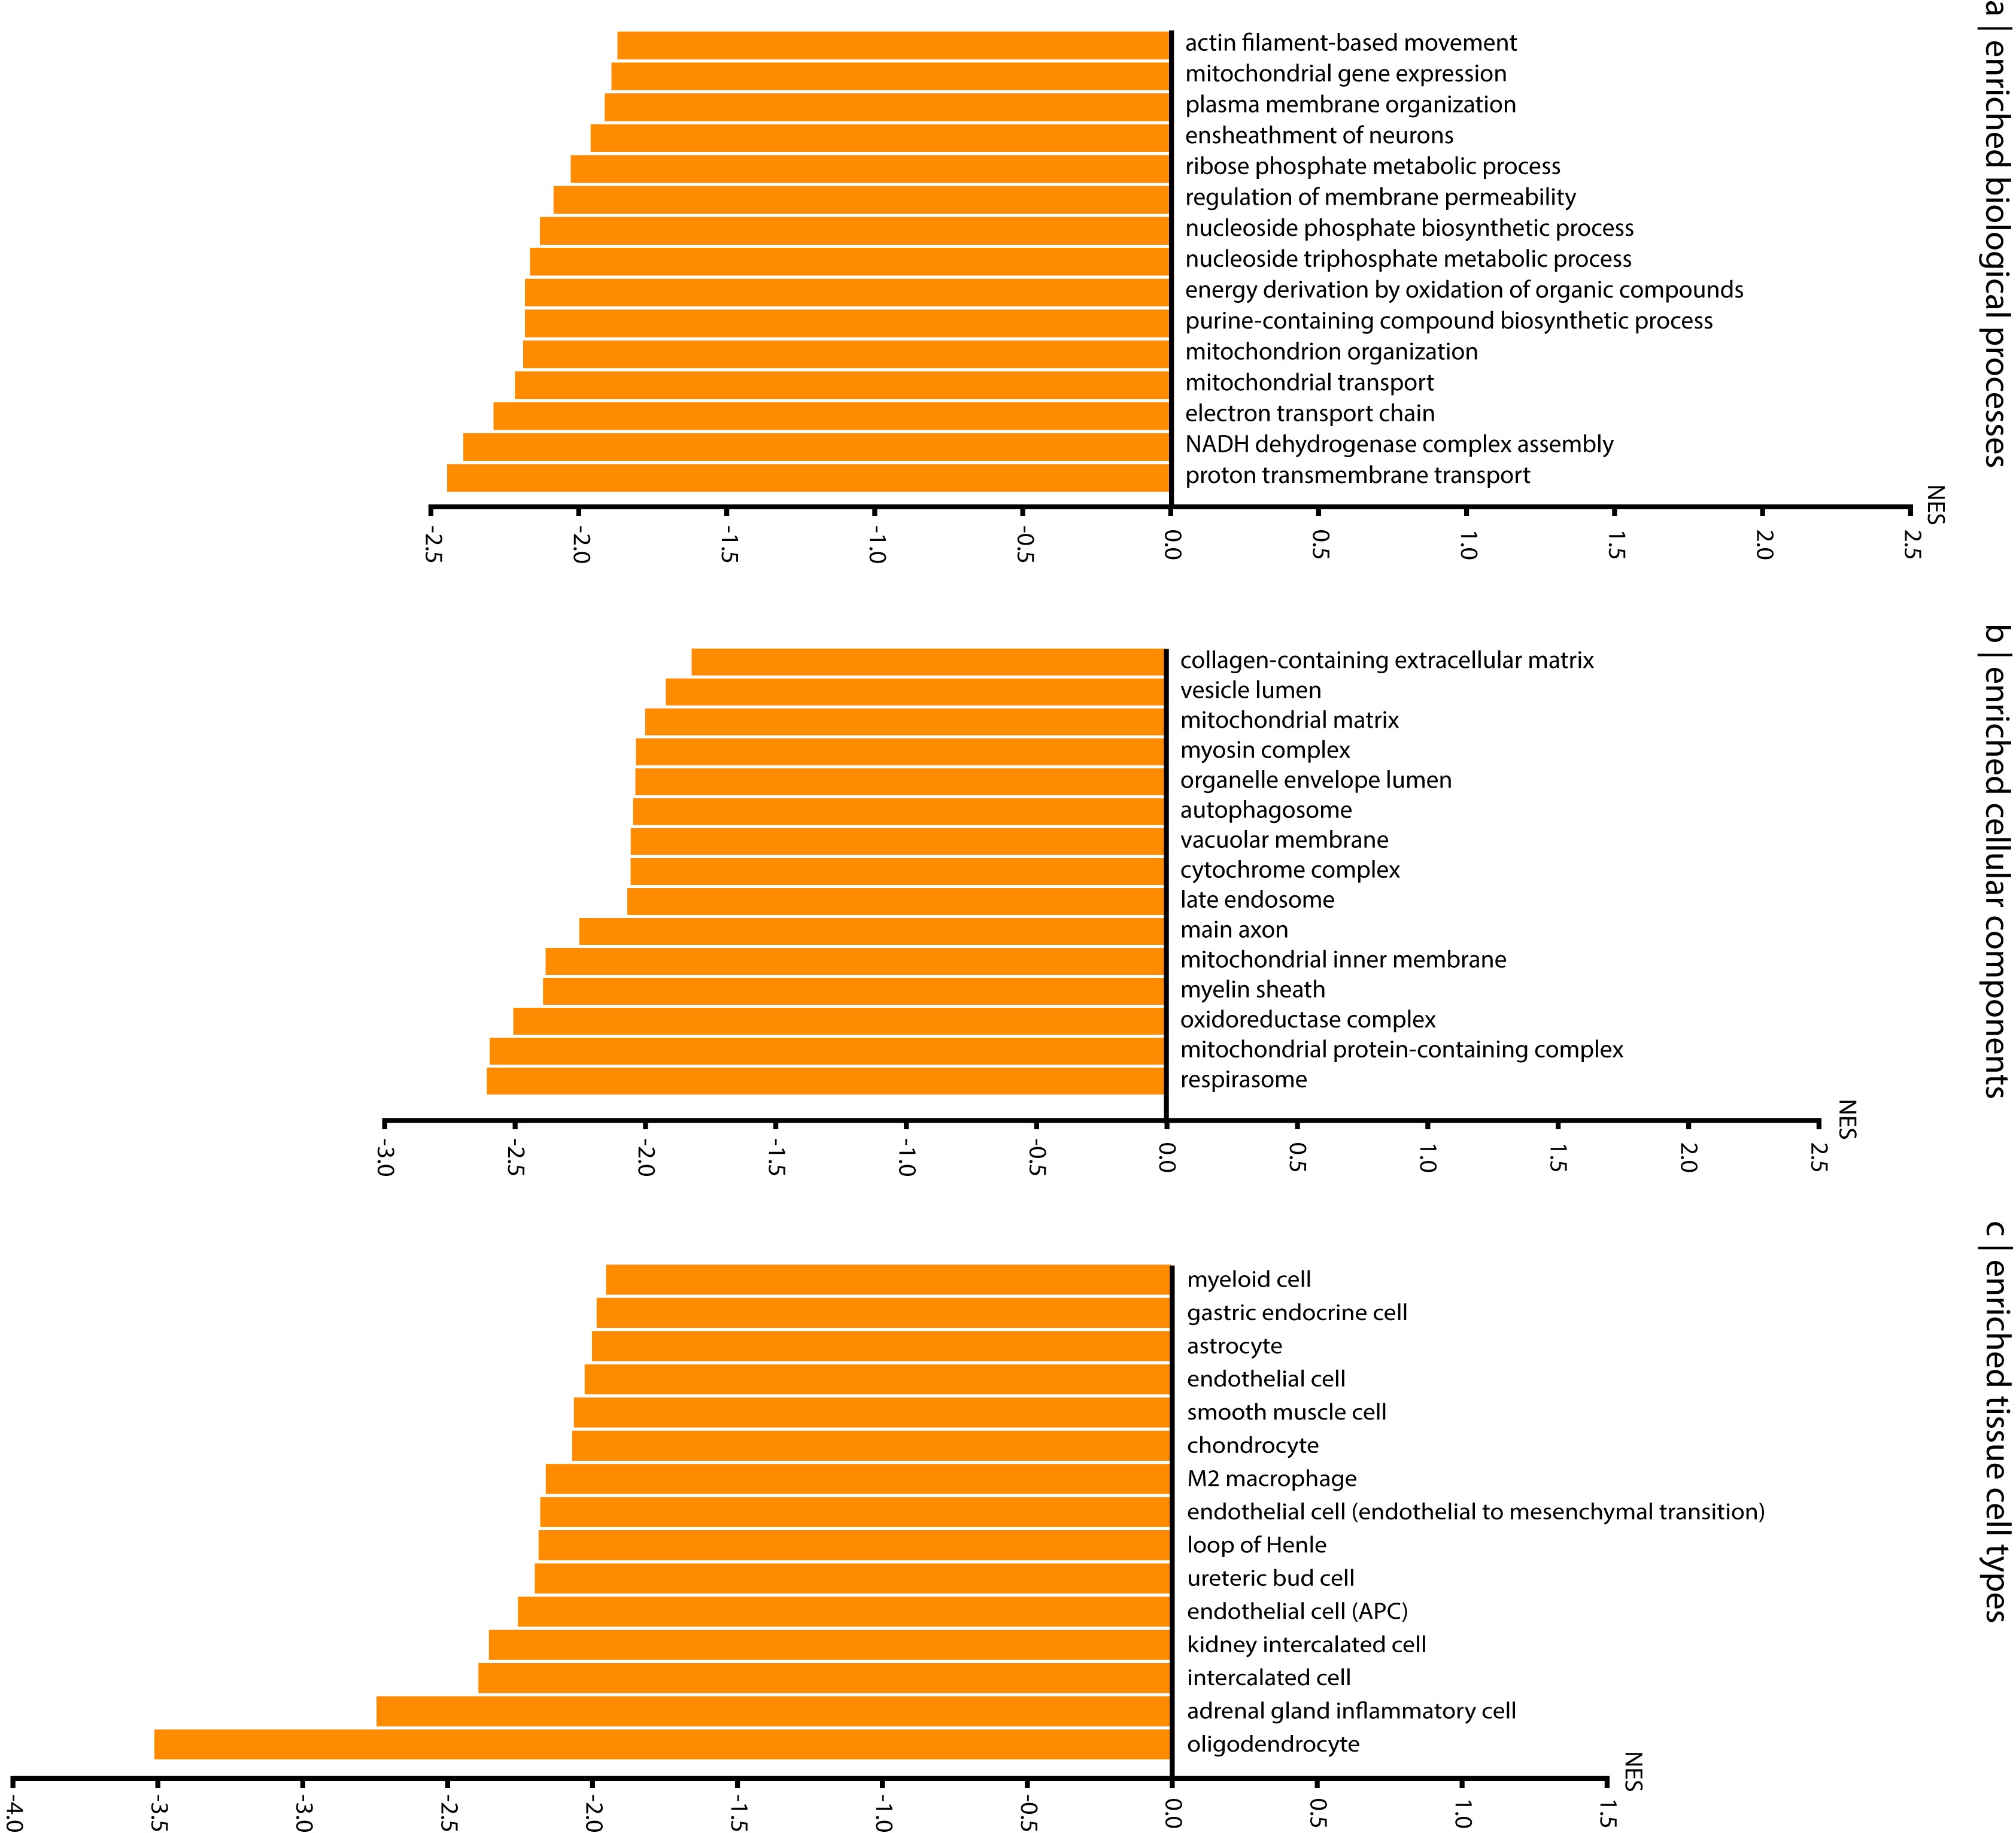
Gene set enrichment analysis
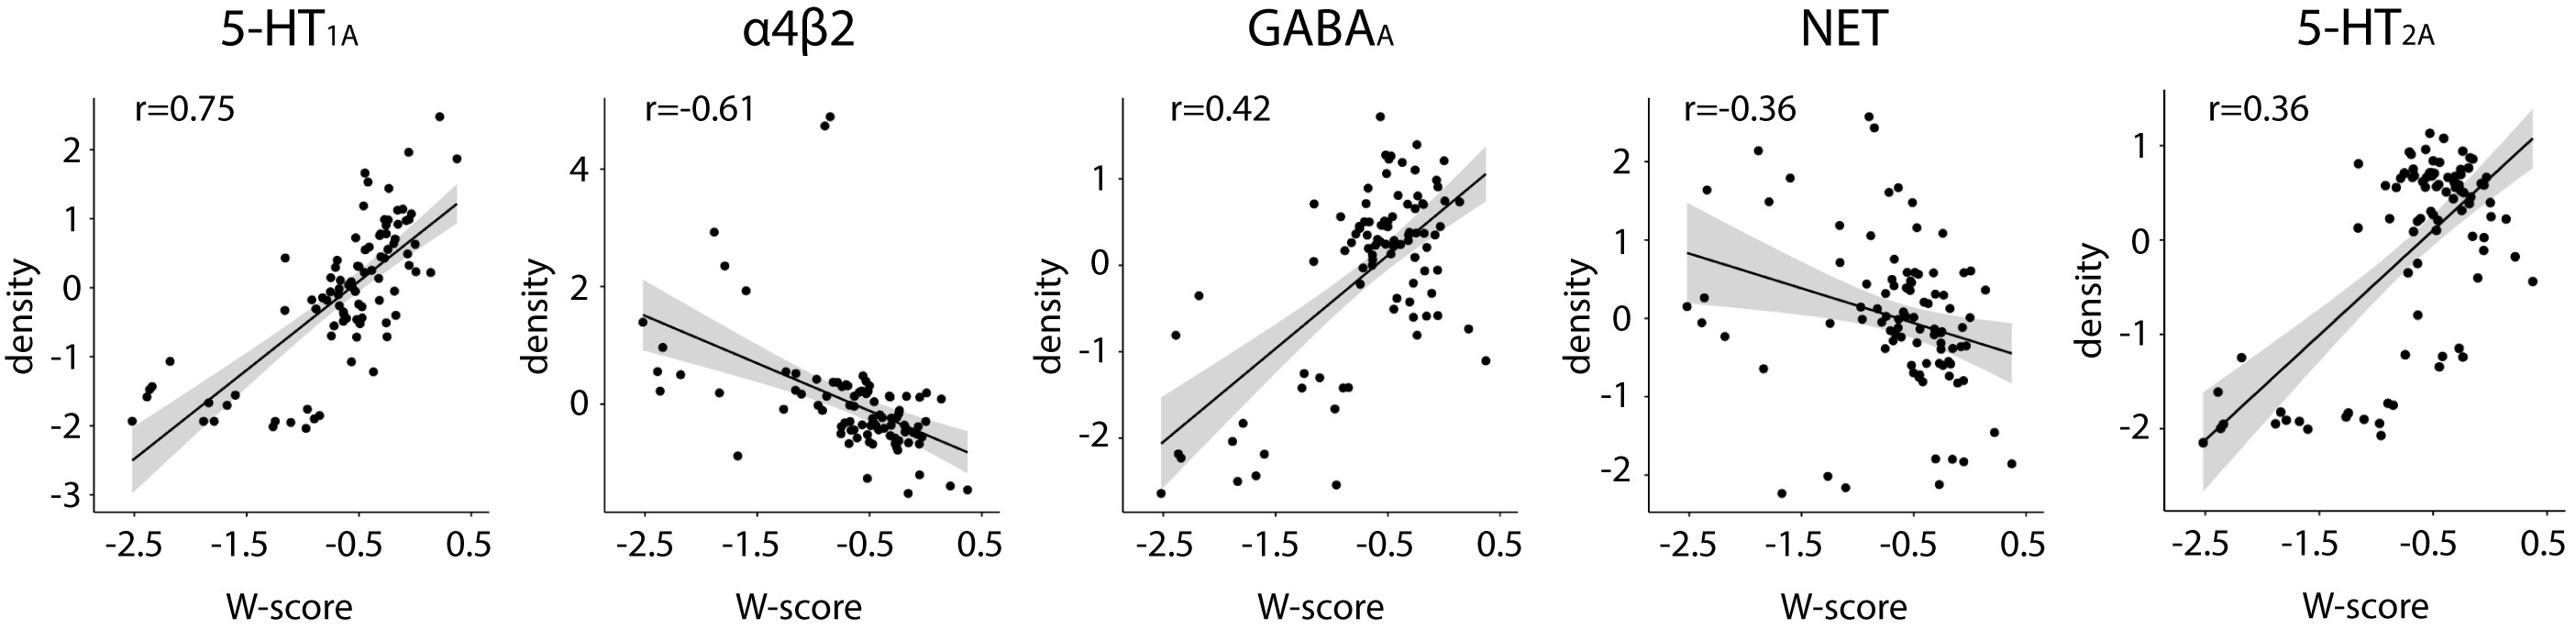
Neurotransmitter mapping analysis
References: 1. Arnatkeviciute A, Fulcher BD, Bellgrove MA, Fornito A. Imaging Transcriptomics of Brain Disorders. Biol. Psychiatry Glob. Open Sci. 2022;2(4):319–331.
2. Arnatkeviciute A, Markello RD, Fulcher BD, et al. Toward Best Practices for Imaging Transcriptomics of the Human Brain. Biological Psychiatry 2023;93(5):391–404.
3. Hansen JY, Shafiei G, Markello RD, et al. Mapping neurotransmitter systems to the structural and functional organization of the human neocortex. Nat. Neurosci. 2022;25(11):1569–1581.
4. Hawrylycz MJ, Lein ES, Guillozet-Bongaarts AL, et al. An anatomically comprehensive atlas of the adult human brain transcriptome. Nature 2012;489(7416):391–399.
To cite this abstract in AMA style:
L. Chougar, C. Tremblay, A. Delva, M. Filiatraul, A. Vo, J. Hansen, A. Farahani, B. Misic, P. Khalafi, CE. Castonguay, G. Rouleau, JC. Corvol, M. Vidailhet, B. Degos, D. Grabli, S. Lehéricy, A. Dagher, S. Rahayel. Atrophy In Multiple System Atrophy Relates To Mitochondrial And Oligodendrocytic Processes [abstract]. Mov Disord. 2025; 40 (suppl 1). https://www.mdsabstracts.org/abstract/atrophy-in-multiple-system-atrophy-relates-to-mitochondrial-and-oligodendrocytic-processes/. Accessed July 7, 2026.« Back to 2025 International Congress
MDS Abstracts - https://www.mdsabstracts.org/abstract/atrophy-in-multiple-system-atrophy-relates-to-mitochondrial-and-oligodendrocytic-processes/