Category: Parkinson's Disease: Neuroimaging
Objective: Compare VMAT2 PET signal with DATscan at baseline and over time, and evaluate their correlations with MDS-UPDRS III.
Background: DATscan is a Parkinson’s disease (PD) diagnostic tool used to visualize and measure dopamine transporters in the brain where its signal loss reflects nigrostriatal degeneration. DATscan’s poor sensitivity to PD progression limits its use in evaluating potential disease modifying therapies. VMAT2 PET visualizes and quantifies striatal VMAT2 and is thought to reflect synaptic integrity of monoaminergic neurons. However, its sensitivity to disease progression and performance relative to DATscan are unknown.
Method: PD patients in the Parkinson’s Progression Marker Initiative (PPMI) with ≥2 VMAT2 PET scans (n=48) were analyzed; 45/48 had ≥2 DATscans which were used for comparison. Five healthy controls (HCs) had a single VMAT2 PET scan, and 4/5 also had DATscans. Each patient’s clinically more affected side was determined using baseline lateralized MDS-UPDRS III subscores. Since PPMI reports DAT signal for total instead of posterior putamen, we used caudate and anterior putamen regions to compare scans and approximated DATscan’s posterior putamen signal based on its anterior and total putamen. PD vs HC baseline regional signals were compared using both scans. Linear regression models were used to assess VMAT2 PET and DATscan signal progressions. Pearson correlations were used to evaluate each scan’s relationship to OFF-state MDS-UPDRS III.
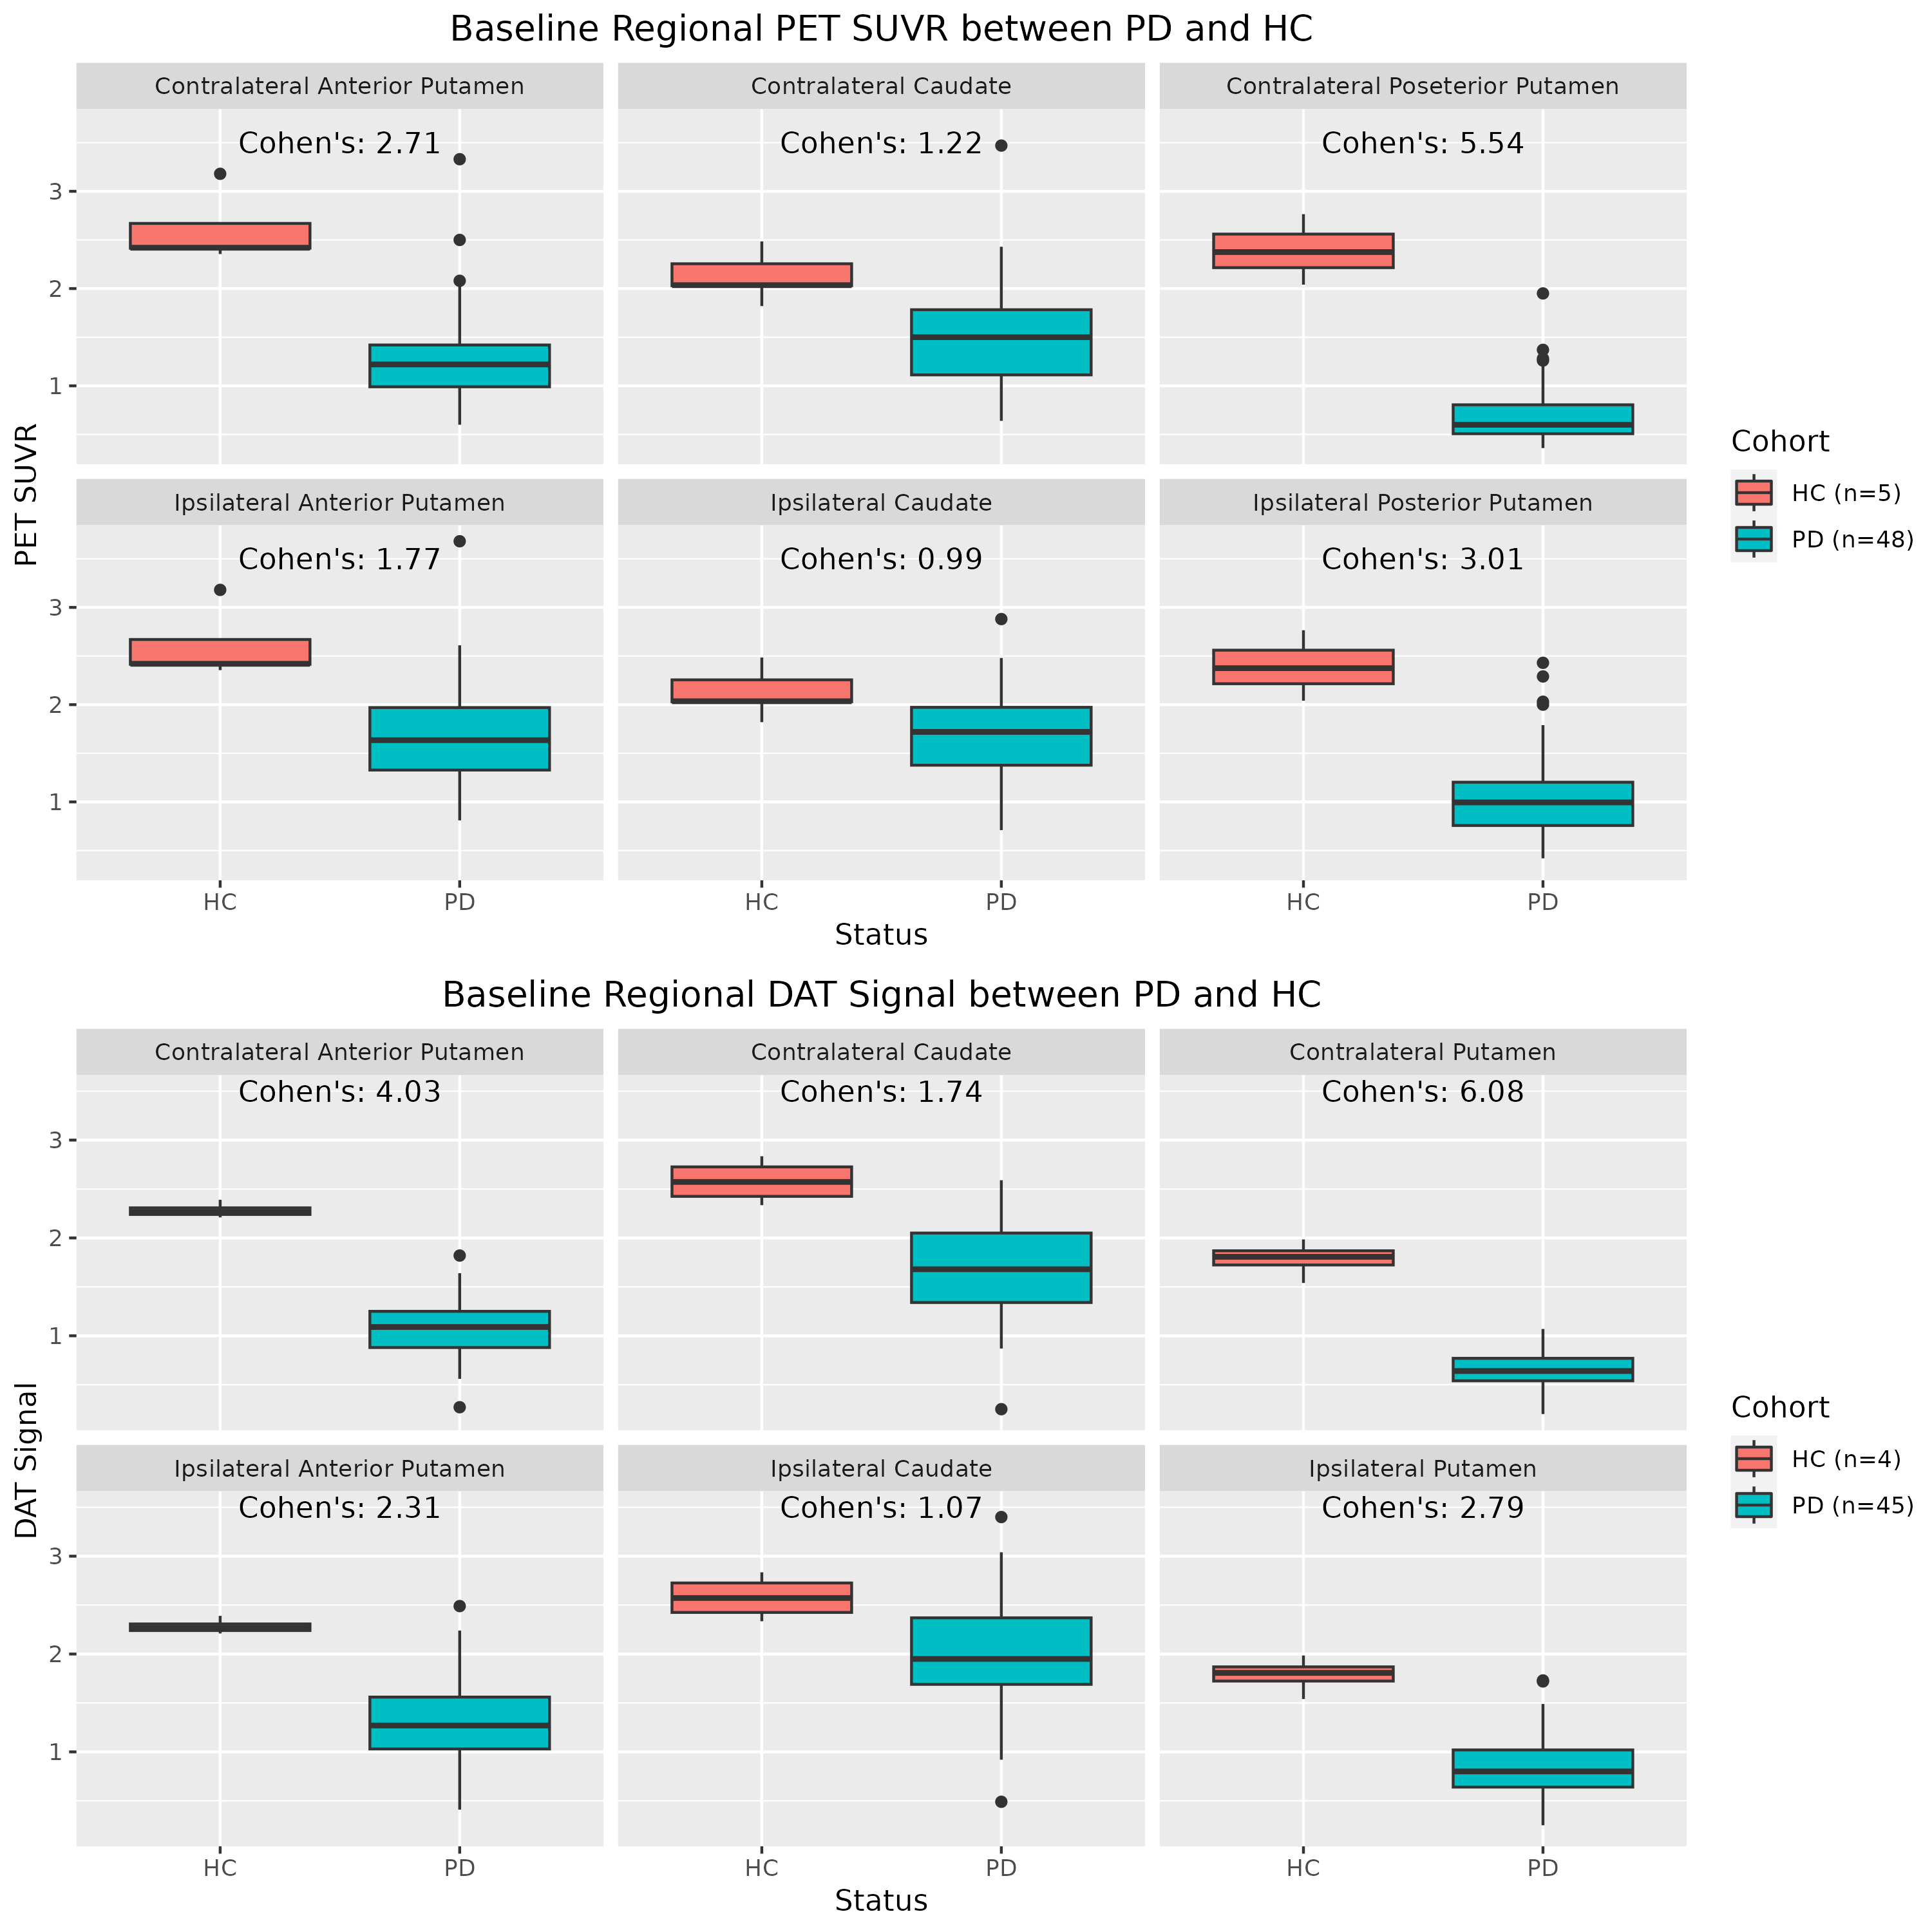
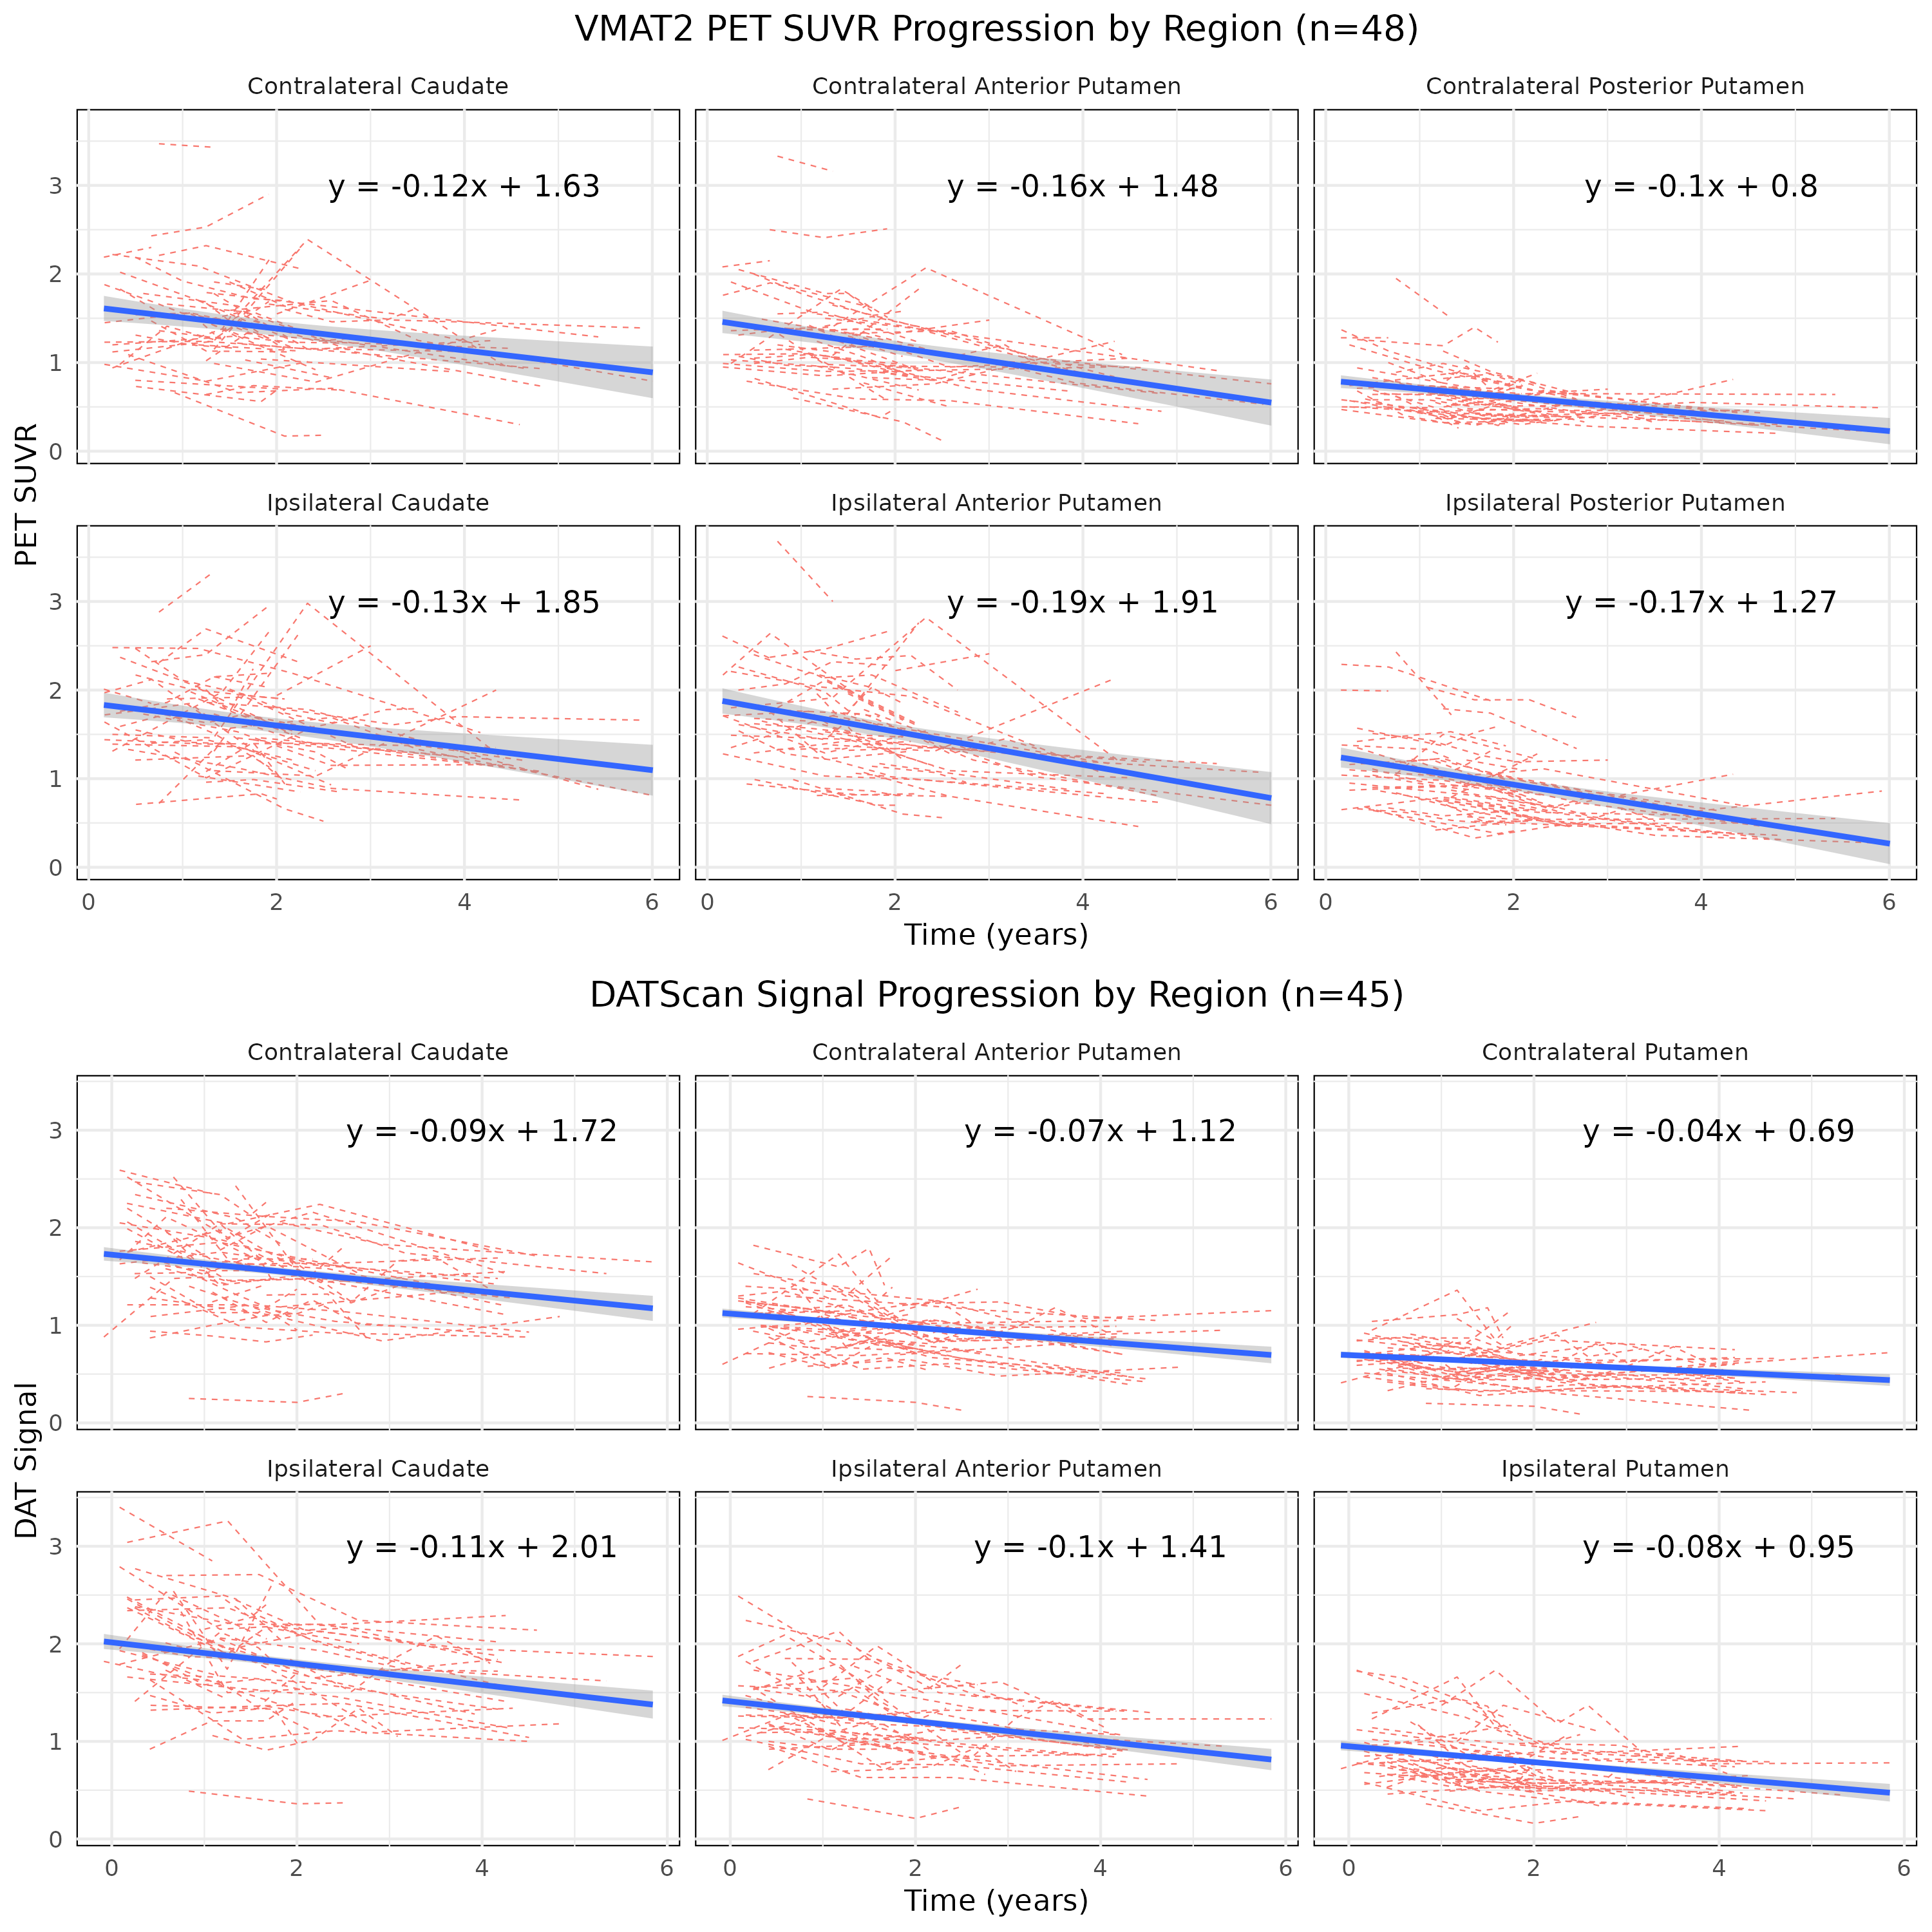
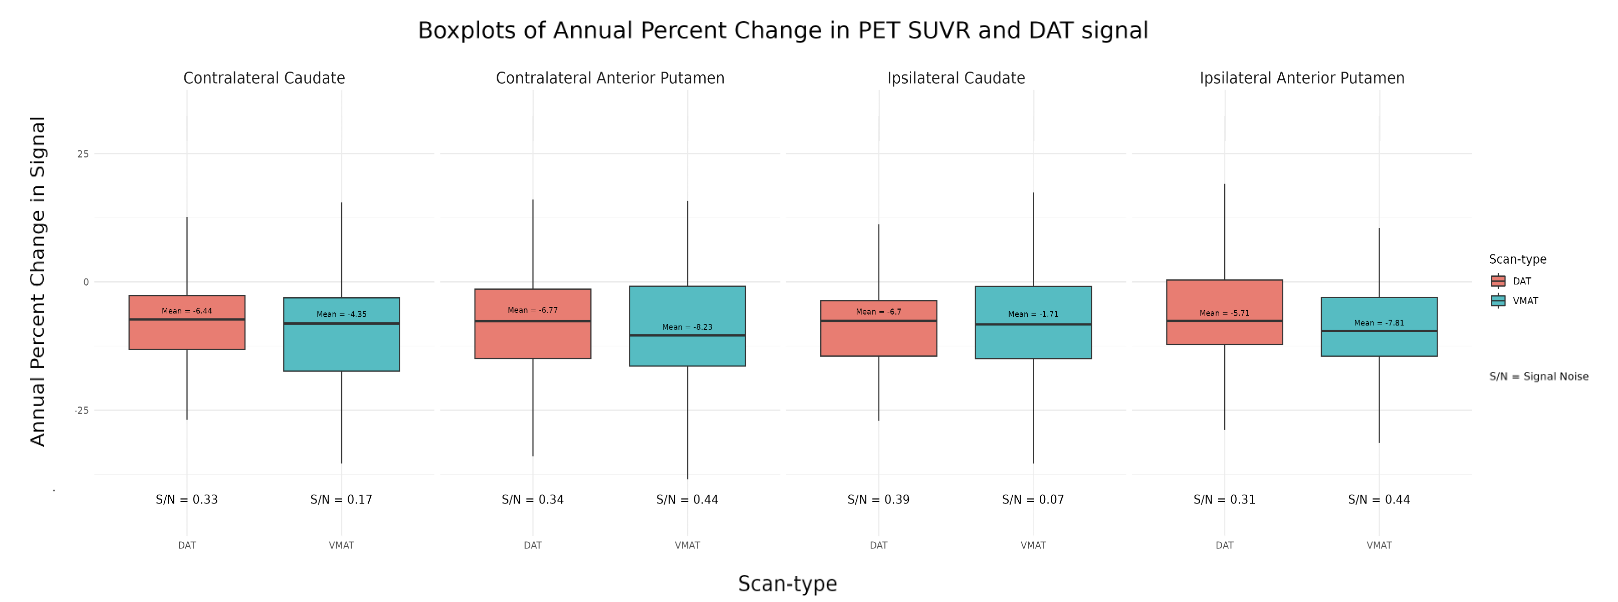
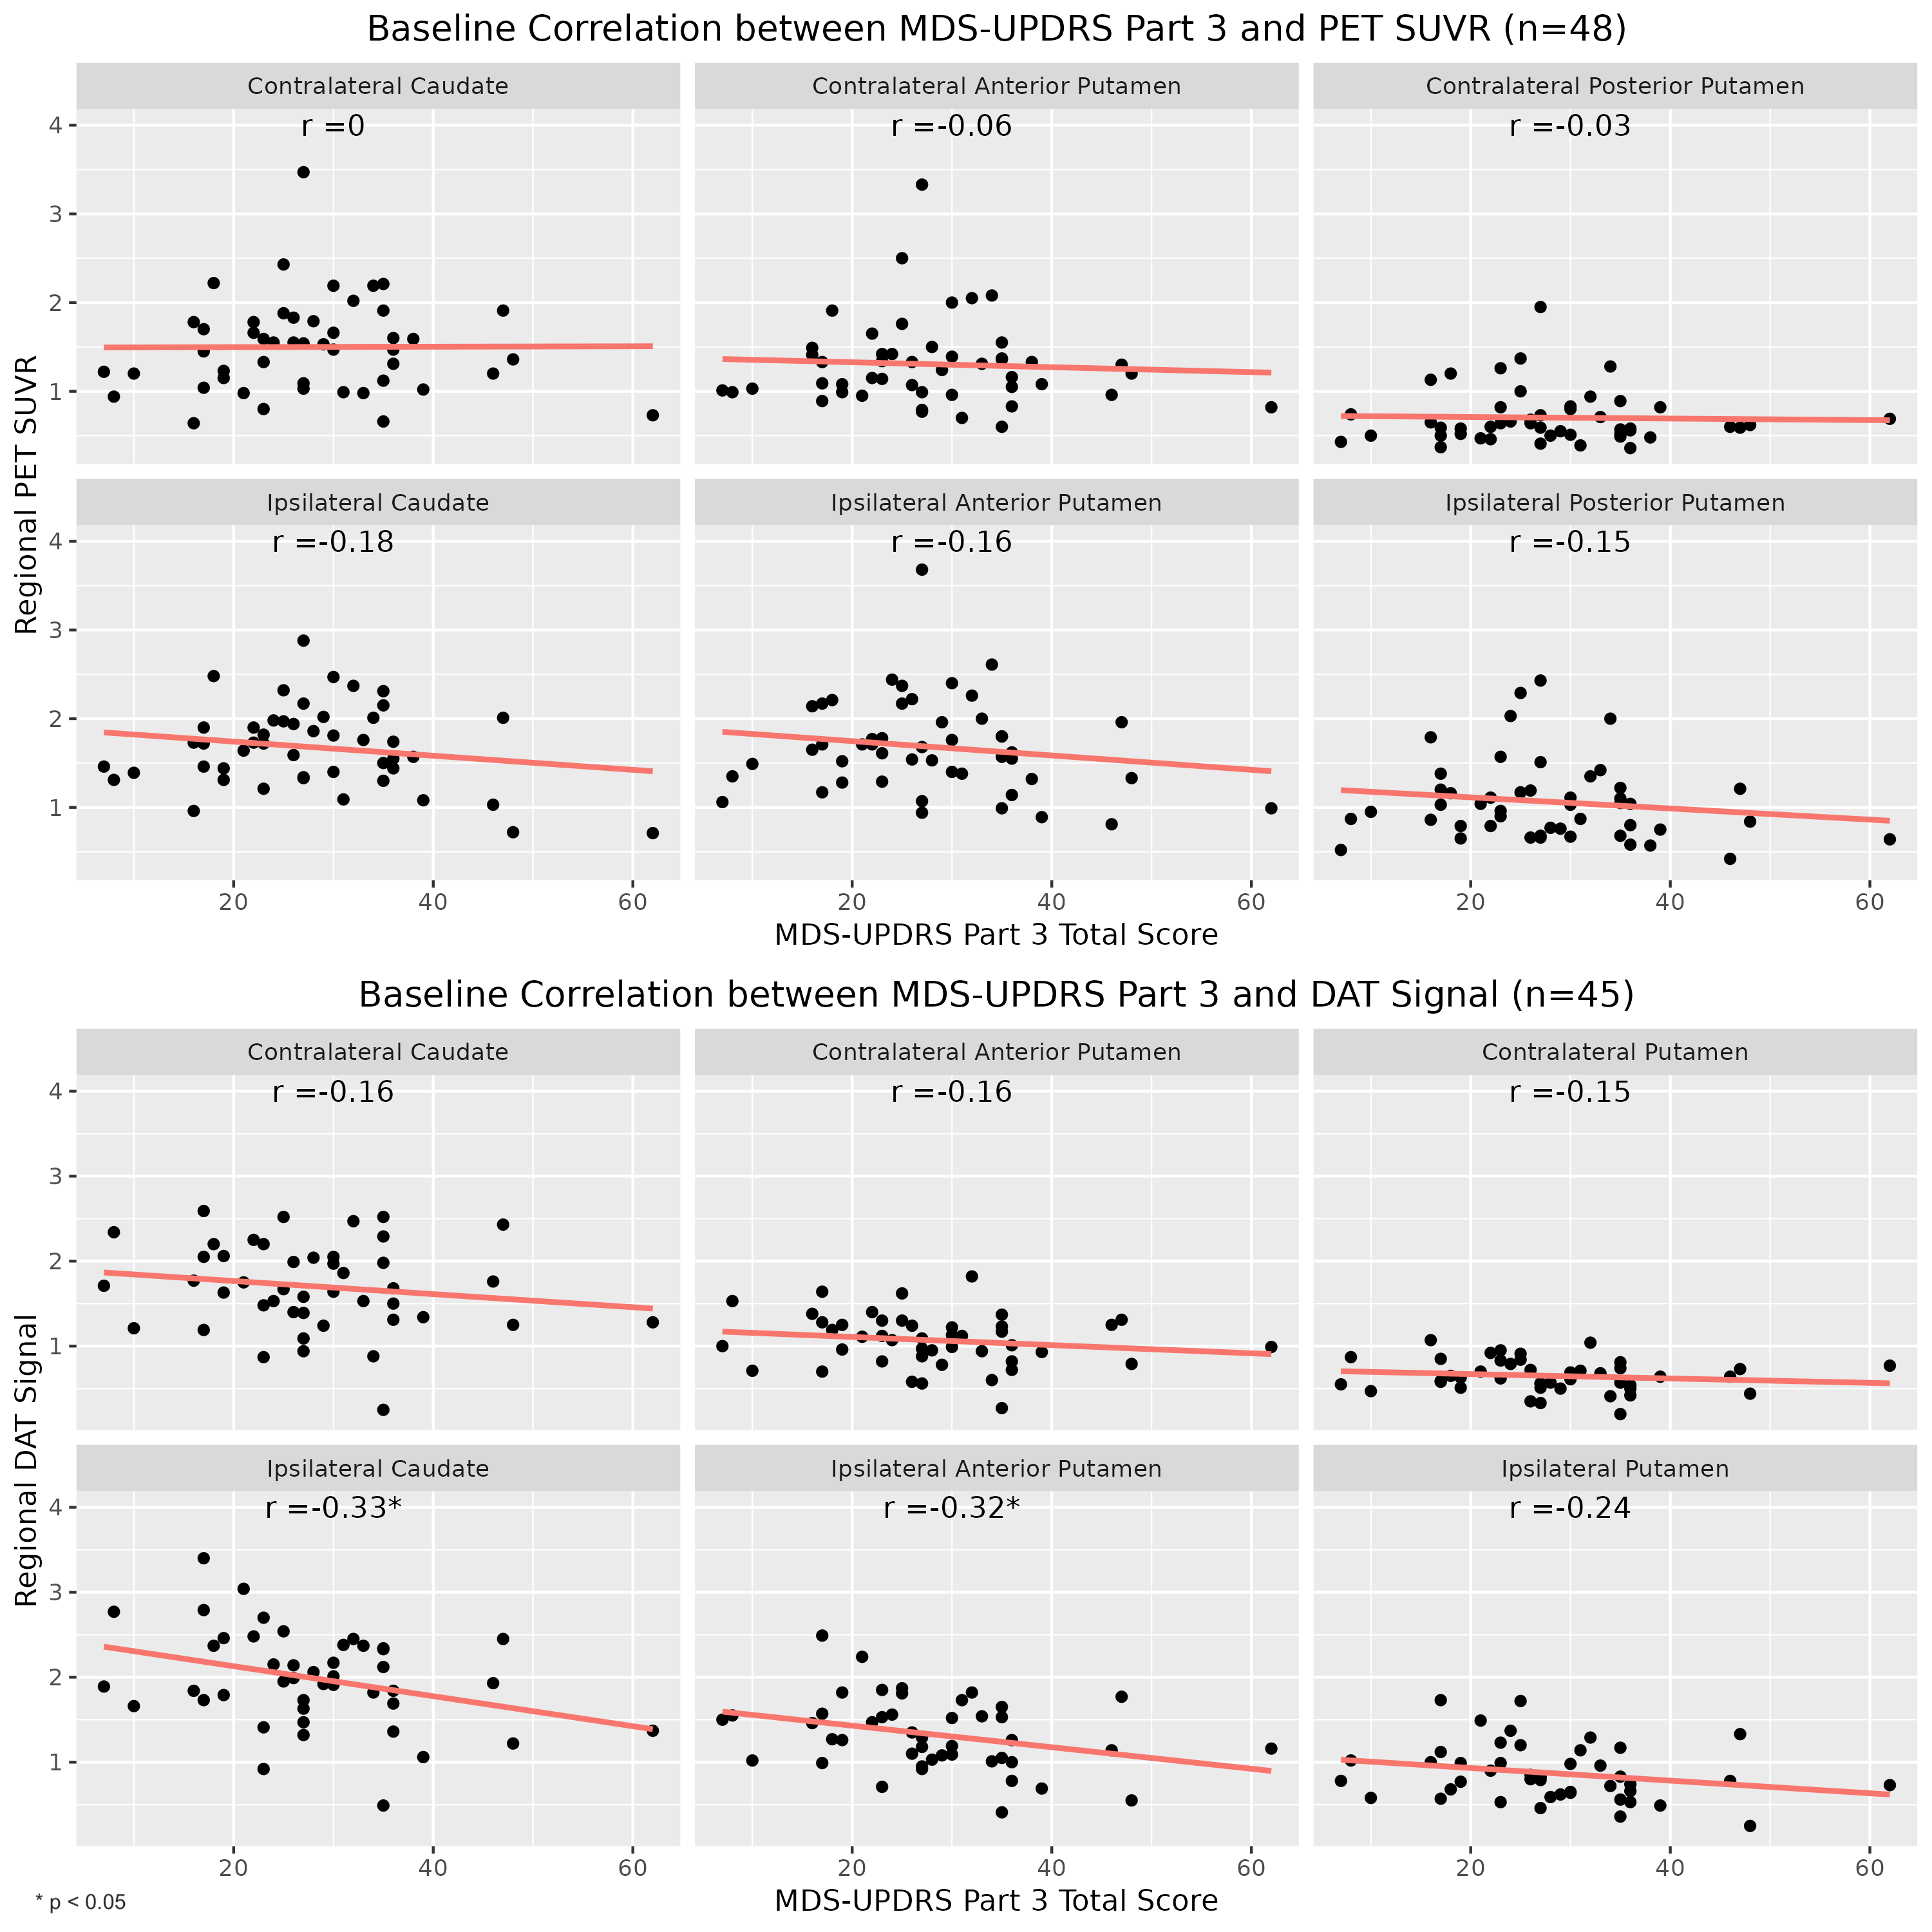
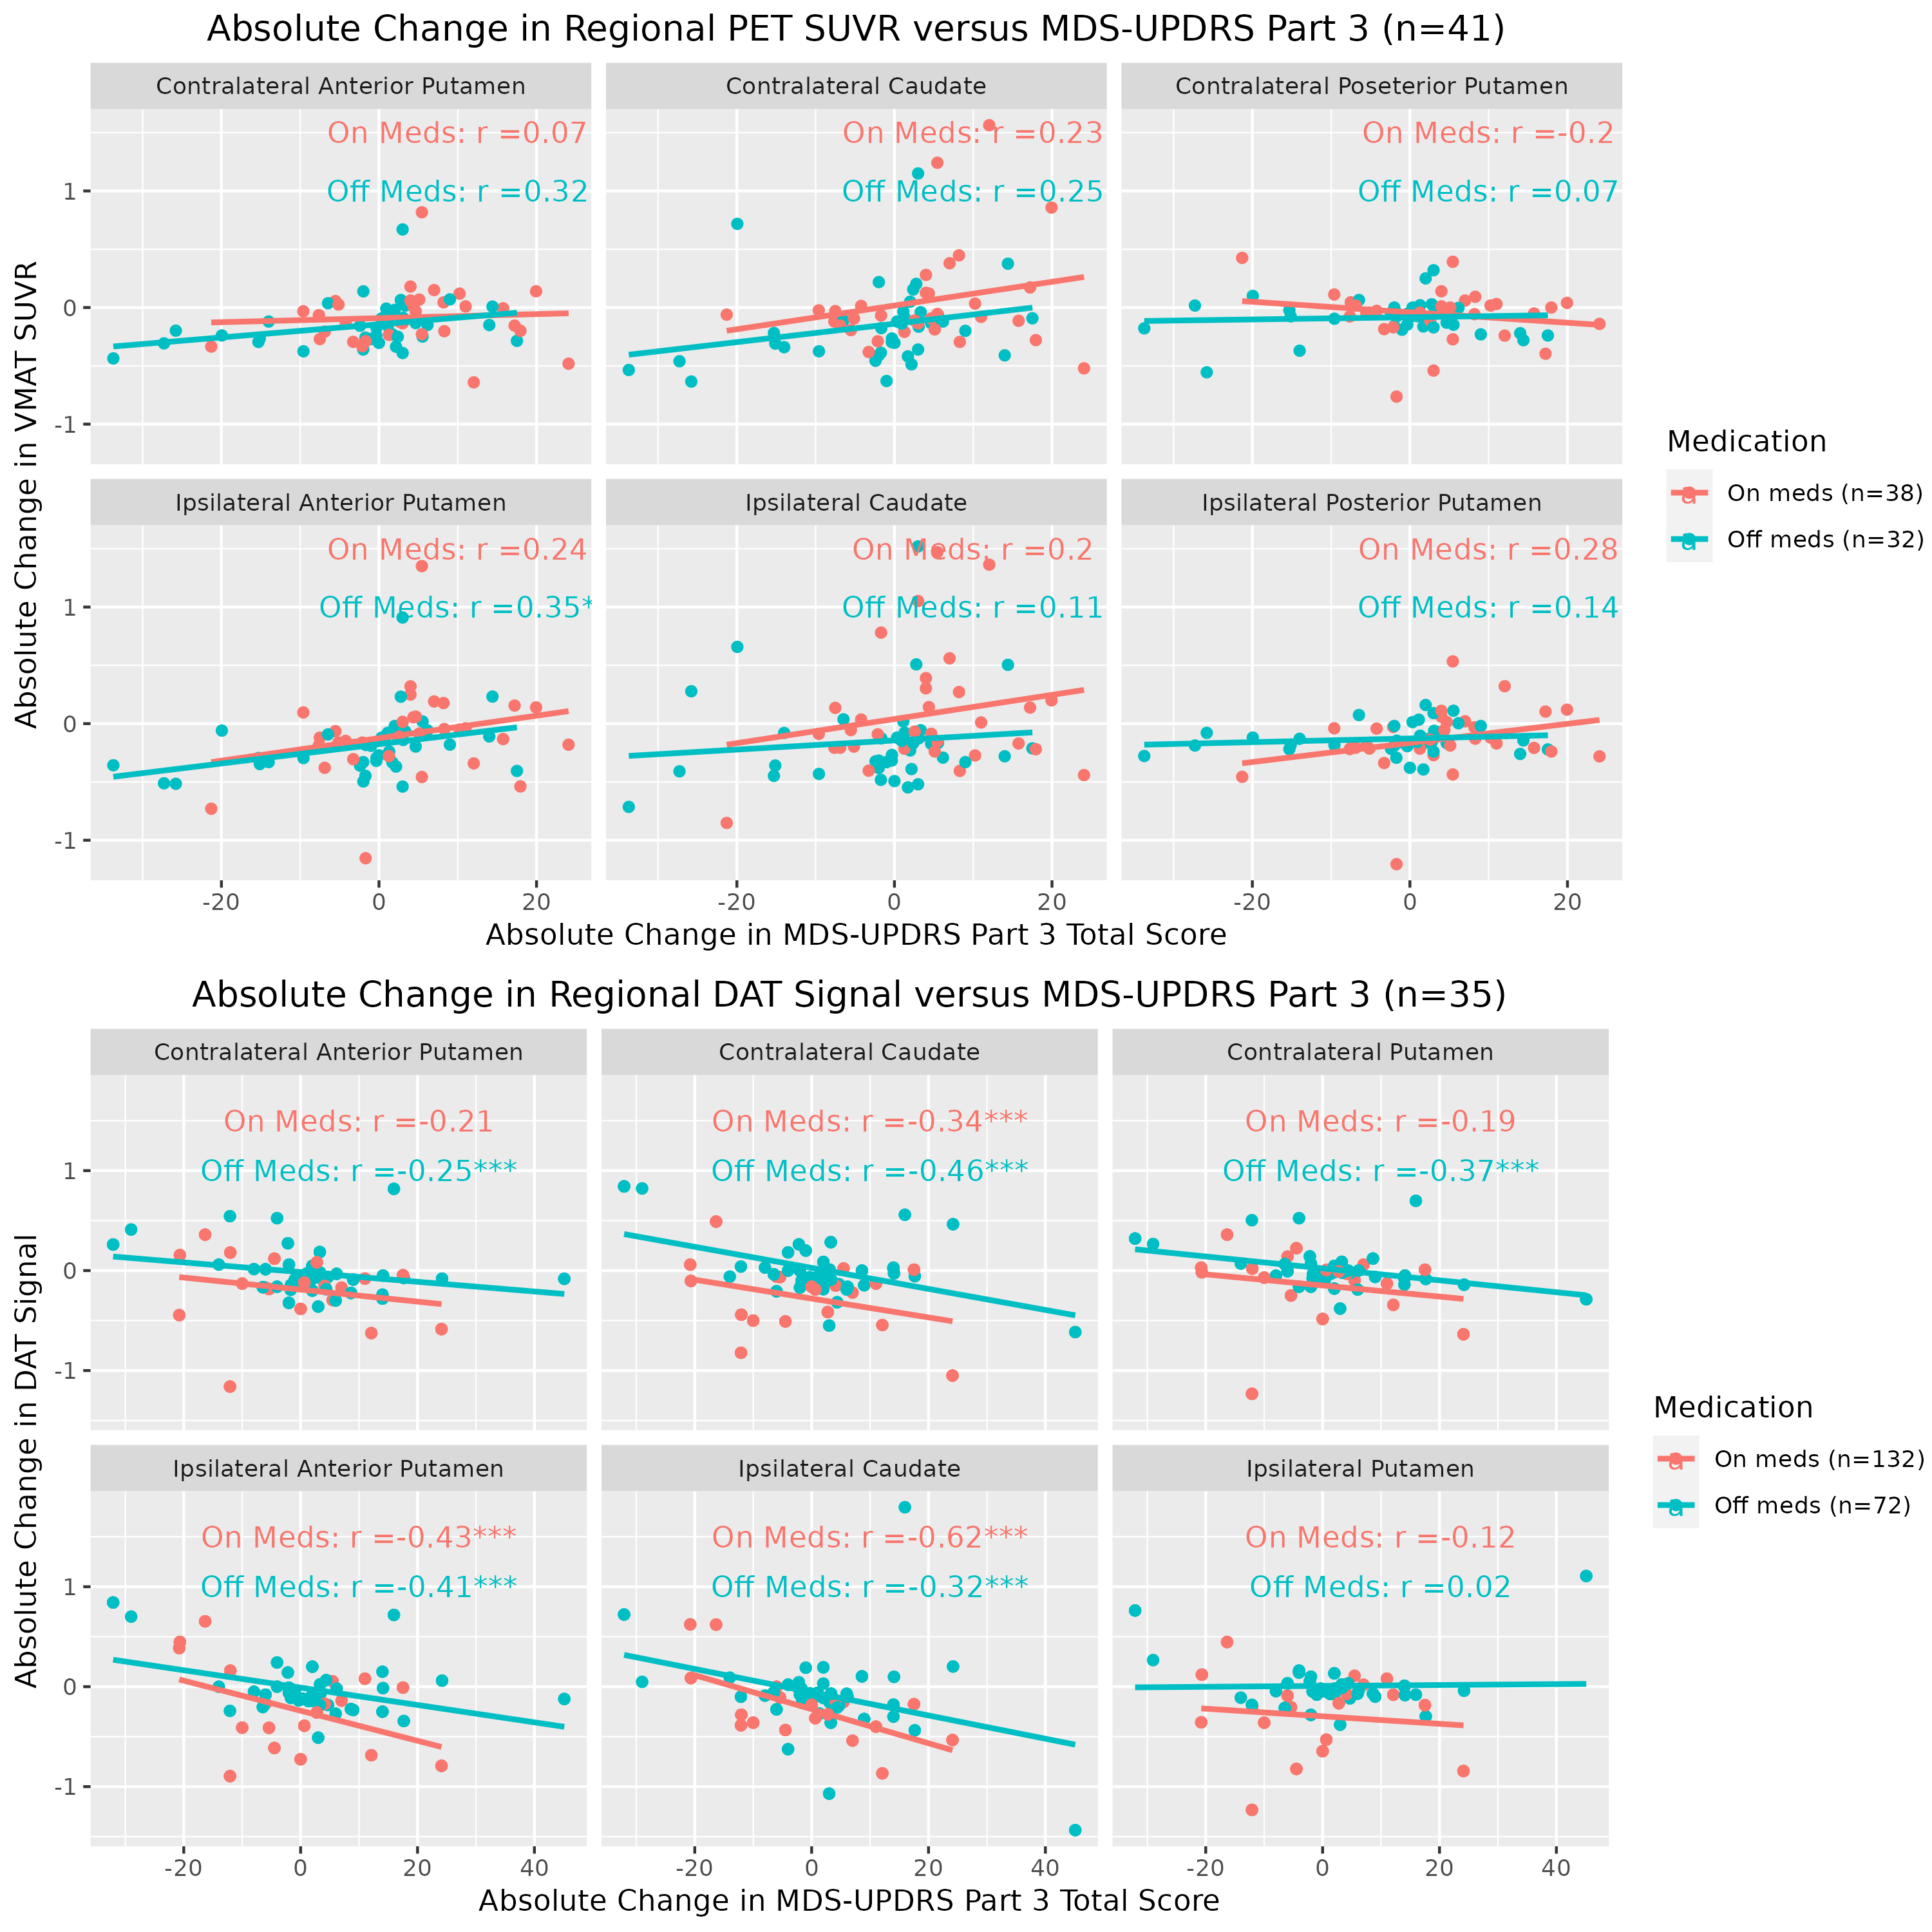
Results: Both VMAT2 PET and DATscan show the largest baseline disease effect sizes in the contralateral posterior putamen and the smallest in the ipsilateral caudate, reflecting known striatal degeneration patterns (Fig. 1). The largest rate of change-over-time was observed in the ipsilateral anterior putamen region from VMAT2 PET (Fig. 2). Overall, DATscan change-over-time showed less variability compared with VMAT2 PET (Fig. 3). At baseline, only DATscan signal in the ipsilateral caudate and ipsilateral anterior putamen were significantly correlated (p<0.05) with MDS-UPDRS III (Fig. 4). Longitudinally, only DATscan signal in the ipsilateral caudate was significantly correlated with changes in MDS-UPDRS III (Fig. 5).
Conclusion: Our results show VMAT2 PET exhibits similar longitudinal characteristics as DATscan, with slightly higher rates of change, but lower correlation with MDS-UPDRS III.
Figure 1
Figure 2
Figure 3
Figure 4
Figure 5
To cite this abstract in AMA style:
M. Miyasaka, A. Avbersek, M. Ahmed, M. Effendi, O. Harari, L. Pham, S. Somersan-Karakaya, L. Sun, O. Levy, F. Sepehrband. Comparing 18F-AV133 VMAT2 PET and DATscan as Markers of Parkinson’s Disease Severity and Progression [abstract]. Mov Disord. 2024; 39 (suppl 1). https://www.mdsabstracts.org/abstract/comparing-18f-av133-vmat2-pet-and-datscan-as-markers-of-parkinsons-disease-severity-and-progression/. Accessed July 18, 2025.« Back to 2024 International Congress
MDS Abstracts - https://www.mdsabstracts.org/abstract/comparing-18f-av133-vmat2-pet-and-datscan-as-markers-of-parkinsons-disease-severity-and-progression/

