Category: Parkinson's Disease: Neuroimaging
Objective: Characterize differences in frontal cortical thickness and volumes in Parkinson’s disease based on impulse control disorder.
Background: Impulse control disorder (ICD) is a debilitating symptom of Parkinson Disease (PD) which can be difficult to predict and diagnose. This includes eating, gambling, hypersexuality, punding, etc. Frontal lobe is associated with complex decision making and has been implicated in impulse control pathway based. ICDs are often undetected at the clinical level until the symptoms begin to severely affects patient’s well-being. Structural neuroimaging differences in cortical thickness could provide a methodology for early detection of ICD symptoms.
Method: This retrospective study utilized data from two centers which included PD with ICD (PD-ICD, n=32) and without ICD (PD-nonICD, n=40) patients. Individuals were grouped based on responses to Movement Disorder Society-Unified Parkinson Disease Rating Scale part I Dopamine dysregulation question and questionnaire for impulsive-compulsive disorder in Parkinson disease. Healthy control (HC) data (n=42) were obtained from Parkinson Progression Marker Initiative project. T1 weighted 1mm3 images were obtained from 3T MRI machine and CAT12 software was used for automated segmentation and obtaining cortical thickness and volume of regions of interest (ROI). Volumes of ROI were summed up for both hemisphere and expressed as ratio (absolute volume/total intracranial volume); cortical thickness of bilateral hemispheres was averaged. Multivariate regression analysis with Bonferroni correction was performed to examine group differences with Atrophy index (grey matter volume/total intracranial volume) as a covariate. Post hoc LSD pairwise comparison was performed.
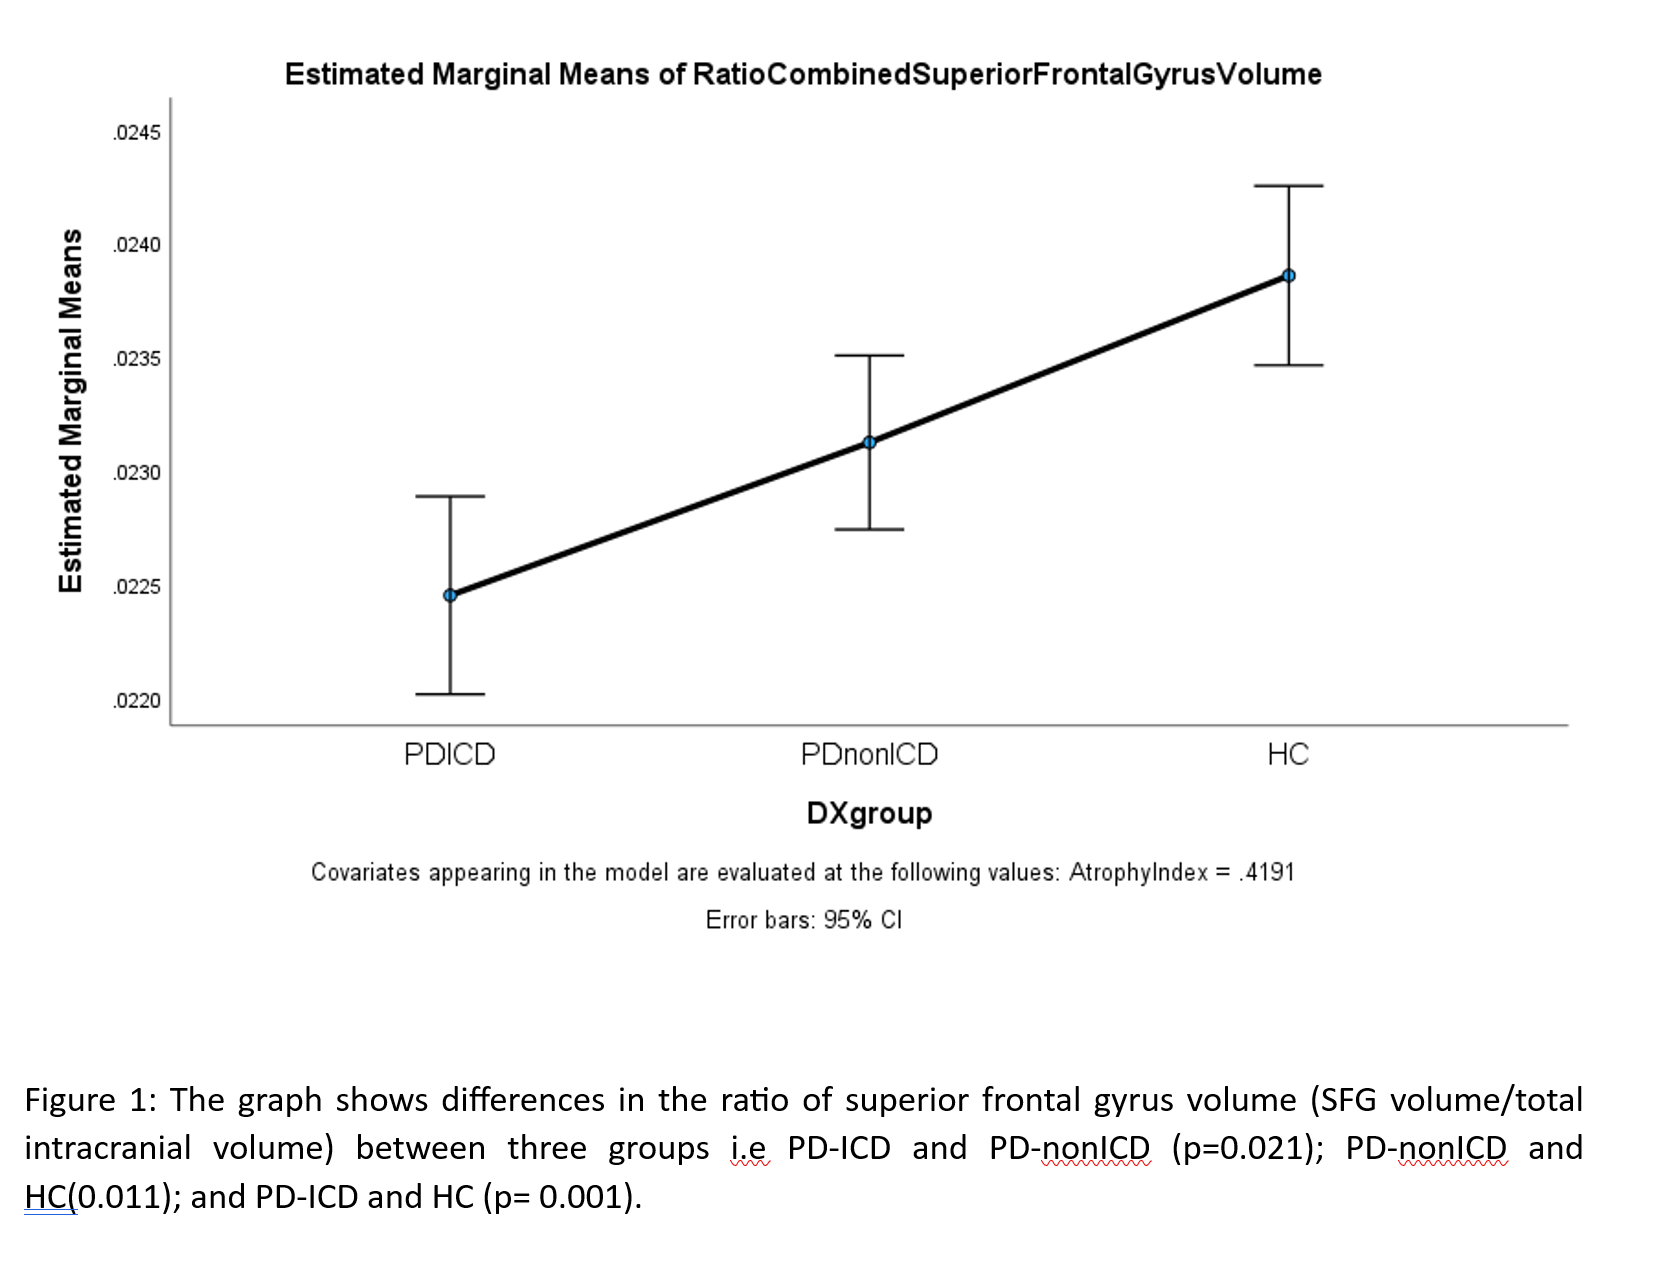
Results: Between-subjects comparisons revealed significant differences in volumes and cortical thickness of all the ROIs namely superior frontal gyrus (SFG), middle frontal gyrus, inferior frontal gyrus, orbitofrontal gyrus (p<0.001). Pairwise comparison post-hoc showed that PD-ICD group had lower SFG volume compared to PD-nonICD and HC groups (Figure. 1).
Conclusion: Several areas in frontal lobe show atrophy in PD when compared to HC but only SFG volume showed difference between PD groups based on ICD. Differences in the SFG may be responsible for ICD symptomatology, which aligns with the available literature surrounding ICDs in PD.
Figure 1
To cite this abstract in AMA style:
R. Tripathi, D. Scarisbrick, S. Nkomboni, F. Isbaine, S. Miocinovic, D. Cobia, M. Haut. Frontal Lobe Cortical Thickness and Volumetric Analysis in Parkinson’s Disease Based on Impulse Control Disorder [abstract]. Mov Disord. 2024; 39 (suppl 1). https://www.mdsabstracts.org/abstract/frontal-lobe-cortical-thickness-and-volumetric-analysis-in-parkinsons-disease-based-on-impulse-control-disorder/. Accessed July 3, 2025.« Back to 2024 International Congress
MDS Abstracts - https://www.mdsabstracts.org/abstract/frontal-lobe-cortical-thickness-and-volumetric-analysis-in-parkinsons-disease-based-on-impulse-control-disorder/

